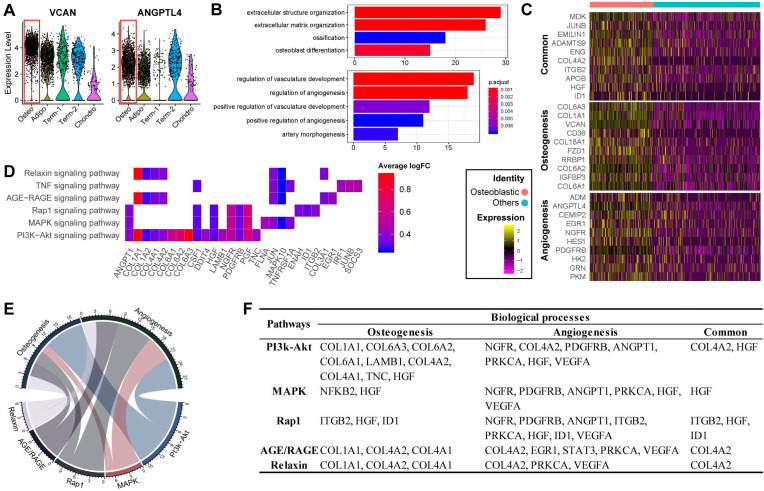
Figure 3.
Functional analysis for ALPLhi osteoblast precursor. (A) Violin plots showing relative expression levels of VCAN and ANGPTL4. Osteoblastic cluster was highlighted by the red box. (B) Enriched GO terms associated with osteogenesis (top) and angiogenesis (bottom) in osteoblast precursors. Bar chart shows the number of genes enriched in each term. Color indicates the adjust p values. (C) Differential expression of osteogenesis- and (or) angiogenesis-related genes (rows) in osteoblast precursors compared to the other cells. Heatmap shows top 10 most significant DEGs in each category, where color indicates the relative expression levels between osteoblast precursors and other cells (z-score). (D) Gene expression pattern in enriched pathways. Squares show enriched DEGs in the corresponding terms (rows). Color indicates the expression value of the DEGs (average logFC). (E-F) Table of genes in biological processes and pathways. (E) Numbers outside the circles indicate the number of genes in that term. Width of curves connecting different terms is proportional to the number of shared genes. (F) Table of the specific genes enriched in each biological process and pathway.

