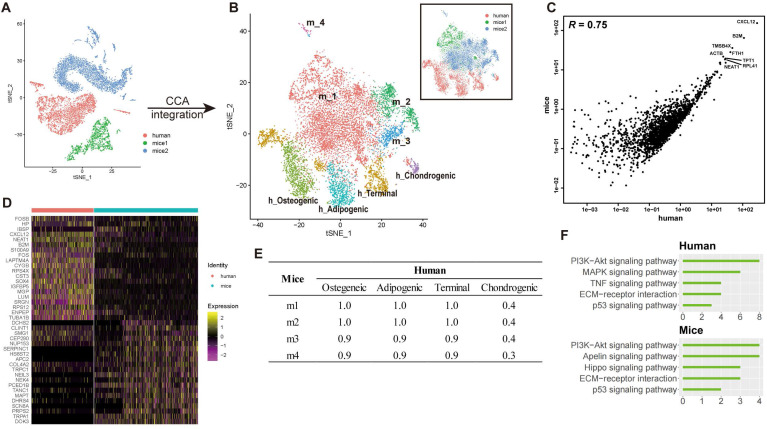
Figure 5.
Integrated cross-species analysis between human and mouse BM-MSCs. (A-B) t-SNE visualization of human and mouse BM-MNCs before (A) and after (B) CCA integration. The labeled texts indicate the datasets or subpopulations identified by clustering analysis. Human (h): data from this study; mice1 (m): data from Tikhonova et al. 7; mice2 (m): data from Baryawno et al. 19. (C) Correlations of gene expression among human and mouse BM-MSCs after CCA integration. Each dot represents an individual gene. Texts indicate highly expressed genes shared between the two species. The average gene expression level is plotted for each subject. Correlations were measured by Pearson correlation coefficients (R, p < 0.01). (D) Gene signature of human and mouse BM-MSCs, based on the relative gene expression level of top 20 most-significant DEGs for each species (z-score). (E) Correlations of gene expression between different subsets of human and mouse BM-MSCs identified by clustering analysis (Osteogenic, chondrogenic, adipogenic and terminal in human; m1-m4 in mice). Values in the table represent the Pearson correlation coefficients (R, p < 0.01). (F) Enriched signal pathways (KEGG terms) of human (top) and mice (bottom) BM-MSCs. Bar chart shows the number of enriched genes in each term.

