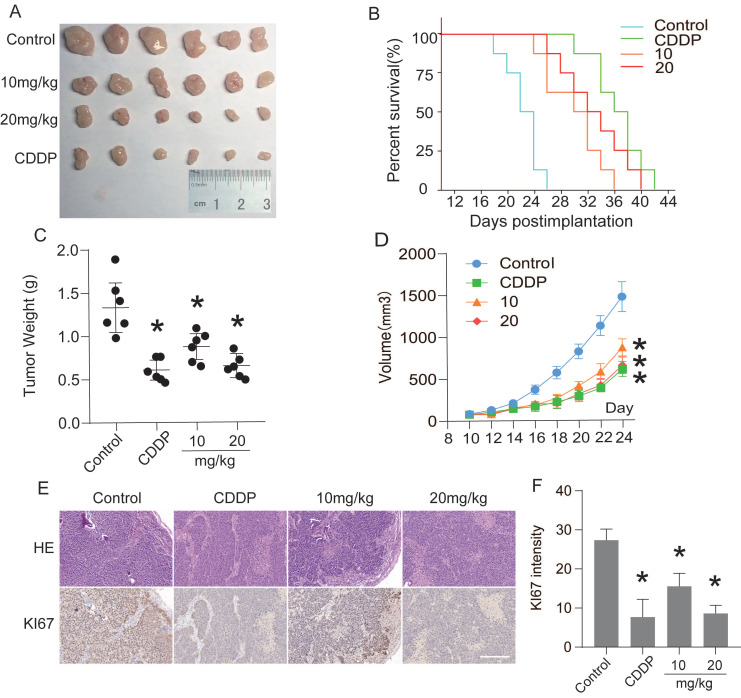
Figure 8.
CEP suppressed transplanted tumor growth in vivo. Twenty-four nude mice were randomly divided into negative control group, positive control group (CDDP, 5 mg/kg, i.p., once two days), low-concentration treatment group (CEP, 10 mg/kg, i.p., once two days) and high-concentration treatment group (CEP, 20 mg/kg, i.p., once two days). (A) Photograph of the tumors. (B) Survival curve of indicated mice, mice with tumors larger than 1000  are considered dead. (C, D) Tumor weight and volume of indicated mice. (E) H&E staining and IHC of KI67 in indicated tumors. (F) Quantitative image analysis of KI67 in (E). Scale bar=100 μm. Data shown are means ± SD; n=3. *P< 0.05, significantly from control group.

