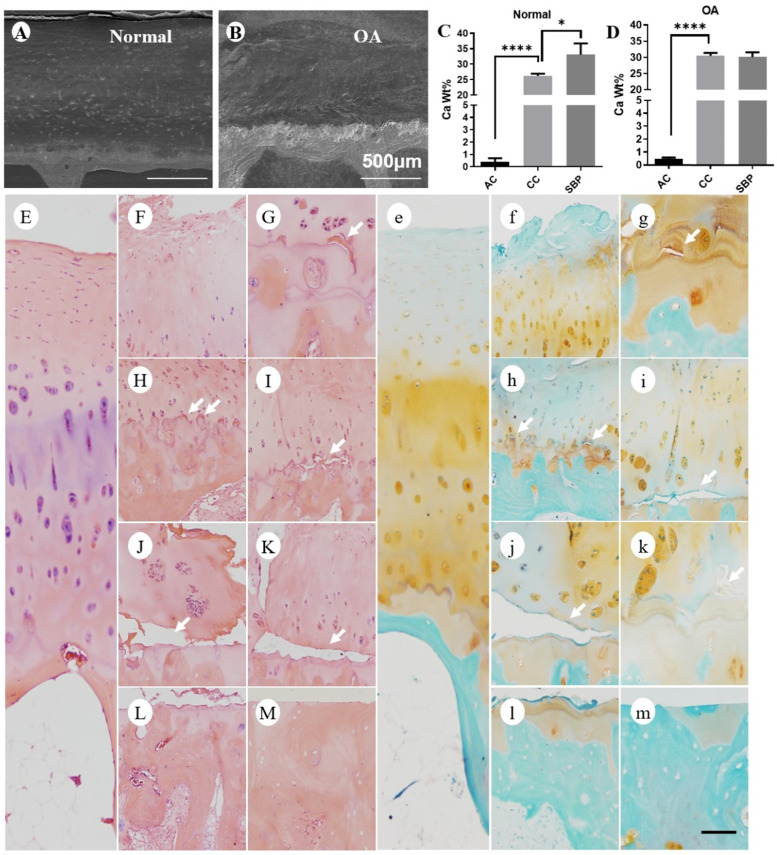
Figure 4.
Calcium content and histologic analysis of articular cartilage in normal and OA patients with a history of long-term usage of Dex. (A-B) Representative images of scanning electron microscopy of articular cartilage in normal (A) and OA (B) patients. (C-D) Calcium content in each layer of articular cartilage (non-calcified cartilage layer: AC, calcified cartilage layer: CC, subchondral bone plate: SBP) was determined by energy dispersive spectrometer in normal (C) and OA (D) patients (n = 3). Scale bar: 500 µm. Comparisons of multiple groups were evaluated using analysis of variance (ANOVA) followed by Tukey's test. Data were expressed as the mean ± SD. *, P < 0.05; **, P < 0.01; ***, P < 0.001; ****, P < 0. 0001. The articular cartilage was stained with H & E (E-M) and Safranin O-fast green (e-m) in normal (E and e) and OA (F-M and f-m) patients (n = 3). Lots of horizontal clefts (arrowheads) can be found in sections of OA patients' samples. Scale bar: 100 µm.

