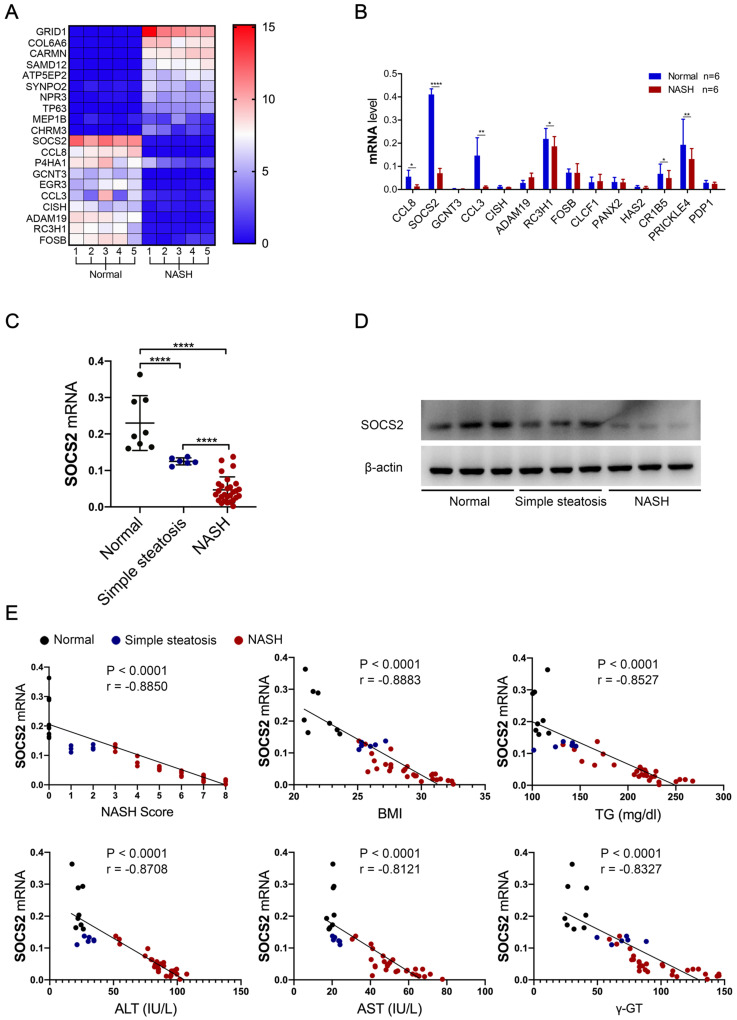
Figure 1.
SOCS2 in macrophages was decreased in macorphages during NASH progression and negative related to NASH level. A. The heatmap from RNA-Seq of human liver macrophages with NASH (n=5) or Normal (n=5). B. The related markers expression were detect by RT-qPCR in human liver macrophages with NASH (n=6) or Normal (n=6). C. The related mRNA level of SOCS2 was detected by RT-qPCR in liver tissue macrophage samples of human subjects without steatosis, with simple steatosis and with NASH. D. Immunoblotting of SOCS2 and β-actin (loading control throughout) in liver tissue macrophage samples of human subjects without steatosis (n=3), with simple steatosis (n=3) and with NASH (n=3). E. Pearson comparison analyses of the correlation between SOCS2 mRNA level and NASH (r = -0.9471), BMI (r = -0.8542), serum TG content (r = -0.8908), serum γ-GT concentrations (r = -0.8406), serum AST concentrations (r = -0.9207) and serum ALT concentrations (r = -0.9112) (n = 153). P < 0.0001 for all of these correlations by Spearman′s rank correlation coefficient analysis.

