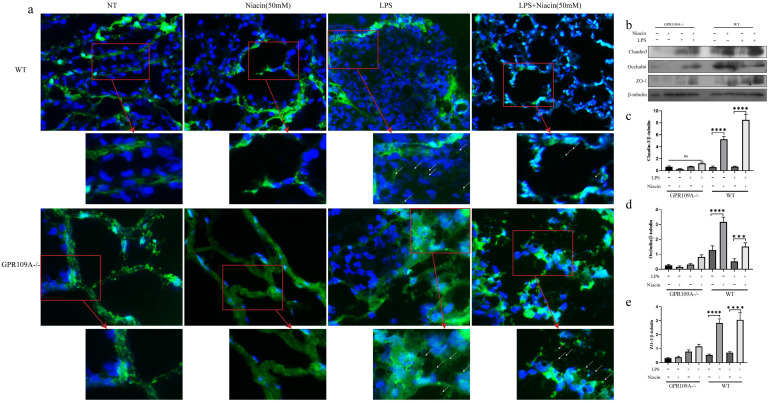
Figure 3.
Penetration of FITC-albumin as it enters mammary acini through the blood milk barrier. Mammary glands from the eight groups were treated with previous description. (a) The color green represent FITC-albumin and the colot blue means nuclei (DAPI). After LPS injection, we can observe green FITC-albumin in mammary acini under fluorescence microscope. (b-e) The levels of Occludin, Claudin 3 and ZO-1. Values are presented as means ± SD (*** p<0.001, **** p<0.0001).

