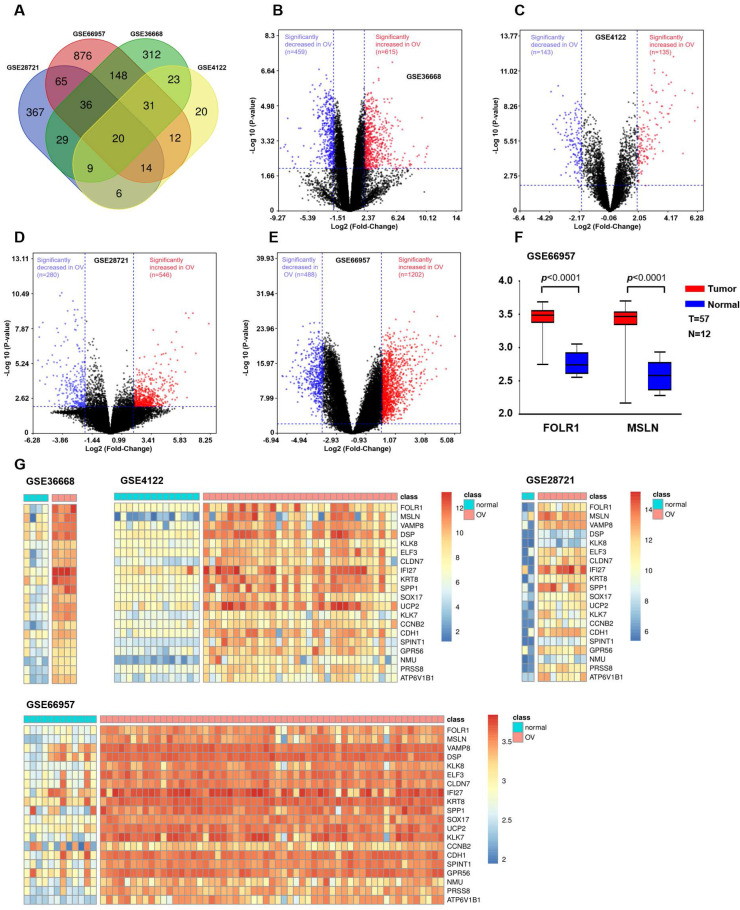
Figure 1.
Bioinformatic analysis to identify candidate genes in OV. (A) Venn diagram depicting the 20 overlapping upregulated genes from four gene expression microarray datasets (GSE28721, GSE66957, GSE36668, and GSE4122). (B) Volcano plot of GSE36668. The dark red and dark blue dots denote the significantly up- and downregulated genes in OV tissues compared to normal tissues, respectively (p value < 0.01 and |log FC|≥2, Student's t-test). (C) Volcano plot of GSE4122. (D) Volcano plot of GSE28721. (E) Volcano plot of GSE66957. (F) In the GSE66957 dataset, elevated expression of FOLR1/MSLN at the mRNA level was observed in OV tissues compared to normal tissues. (G) Heatmap representing the 20 overlapping upregulated genes from different datasets. Red and green indicate high and low expression of the gene in the sample, respectively.

