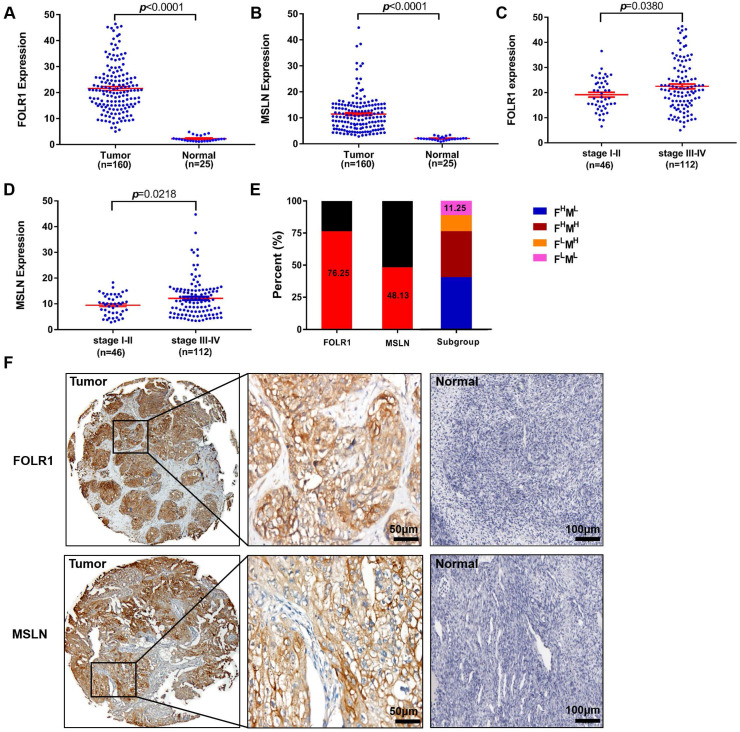
Figure 2.
Upregulated FOLR1/MSLN expression in OV tissues was associated with different stages of disease in patients. (A, B) The expression of FOLR1/MSLN in OV tissues was significantly higher than that in normal tissues. (C, D) The expression of FOLR1/MSLN in OV tissues was significantly higher in advanced stages of the disease. (E) The proportion of FOLR1/MSLN-positive patients in the clinical cohort. Subgroup analysis showed that the percentages of FOLR1high/MSLNlow, FOLR1high/MSLN high, FOLR1low/MSLNhigh, and FOLR1low/MSLNlow patients were 40.63% (65/160), 35.62% (57/160), 12.50% (20/160), and 11.25% (18/160), respectively. (F) Representative photomicrographs of FOLR1 and MSLN expression in ovarian carcinoma tissue and the normal ovary control group. The scale bar represents 50 µm in tumors and 100 µm in normal controls.

