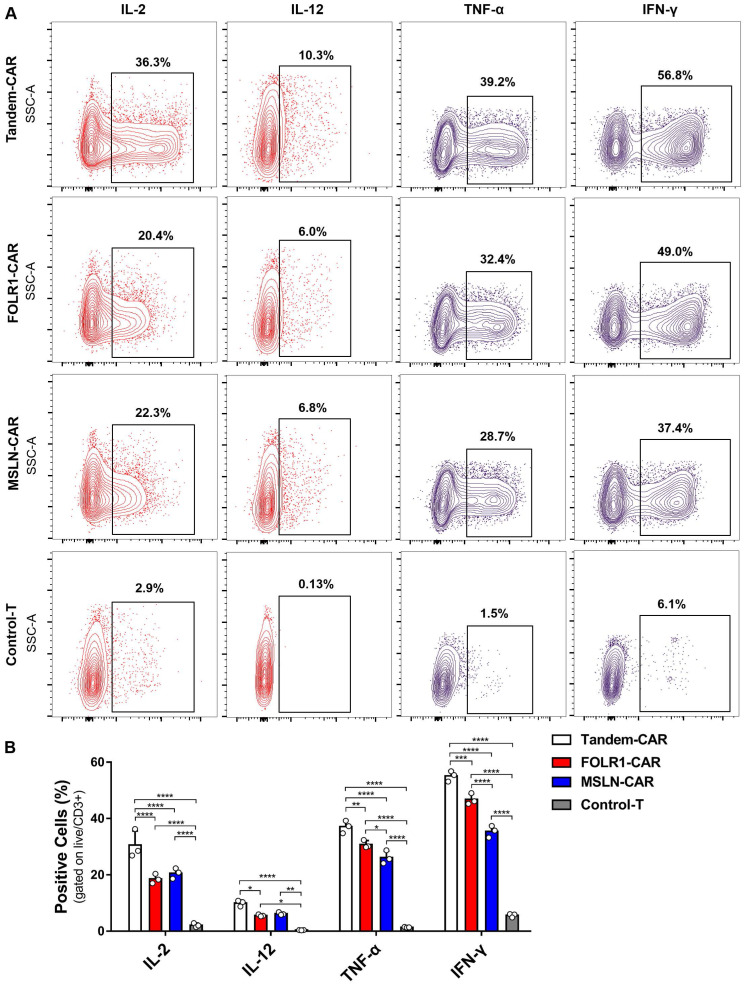
Figure 5.
Cytokine expression profiling of CAR-T Cell. (A) CAR-T cells cocultured with SNU119 cells in triplicate at an E:T ratio of 2:1 for 24 h. The percentage of positive cells was measured by flow cytometric analyses. (B) Statistical analysis of cytokines. All data are shown as the mean ± SD (n = 3). *P < 0.05, **P < 0.01, ***P < 0.001, and ****P < 0.0001.

