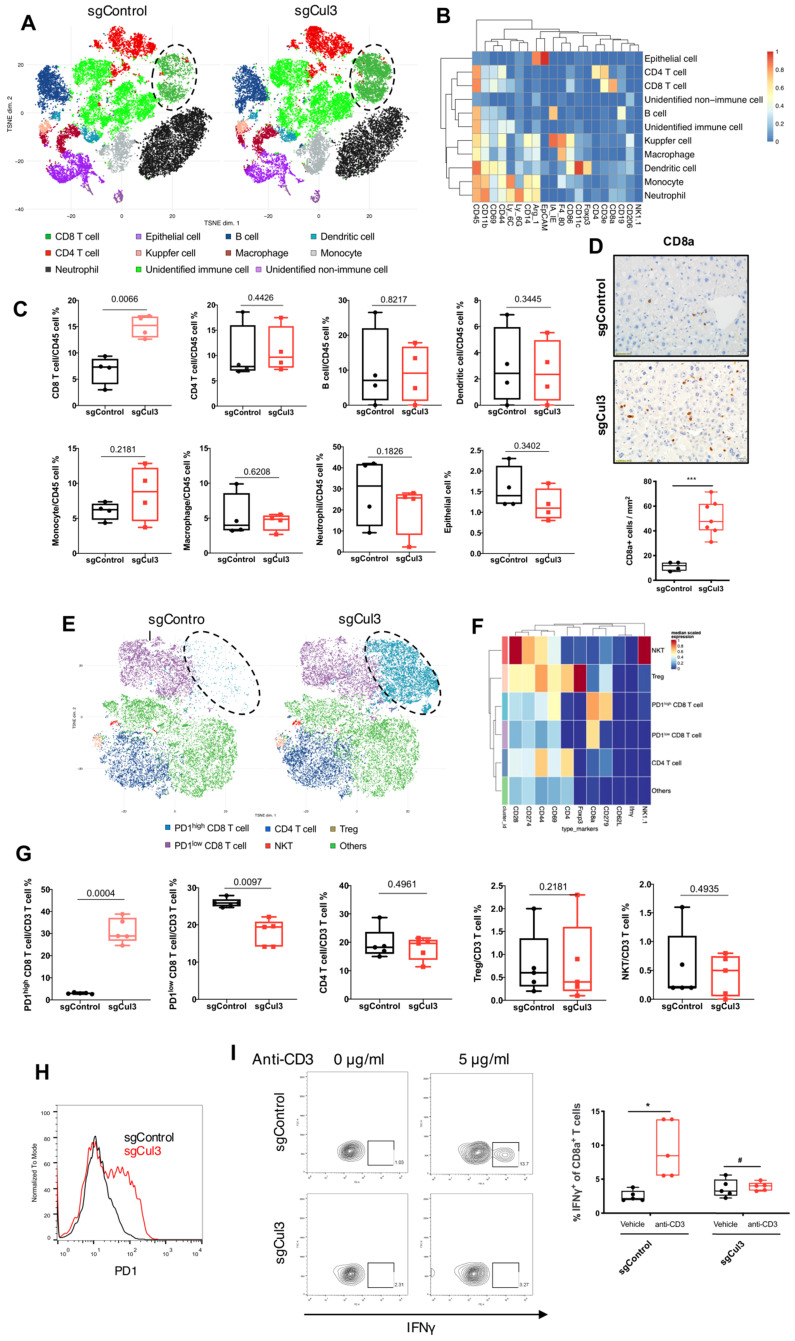
Figure 5.
Cul3 deficiency induces PD1high CD8 T cell accumulation. (A) CyTOF mapping of cells in livers at 2 weeks after injection with sgCul3 or sgControl (n=4). (B) The heat-map shows markers of each annotated lineage. (C) Quantification of each lineages in sgCul3 and sgControl groups (n=4). (D) Representative immunostaining of CD8a T cells in the livers, and quantification of CD8a cell numbers per area (n ). (E) CyTOF mapping of CD3 T cells in livers at 2 weeks after injection with sgCul3 or sgControl (n=5). (F) The heat-map shows markers of each annotated lineage. (G) Quantification of each lineages of CD3 T cells in sgCul3 and sgControl groups (n=5). (H) Flow cytometry analysis shows PD1 level on CD8 T cells in sgCul3 and sgControl groups. (I) Flow cytometry analysis of IFNγ production with anti-CD3 stimulation for 4 hours (n=5). *P<.05, #P>.05.

