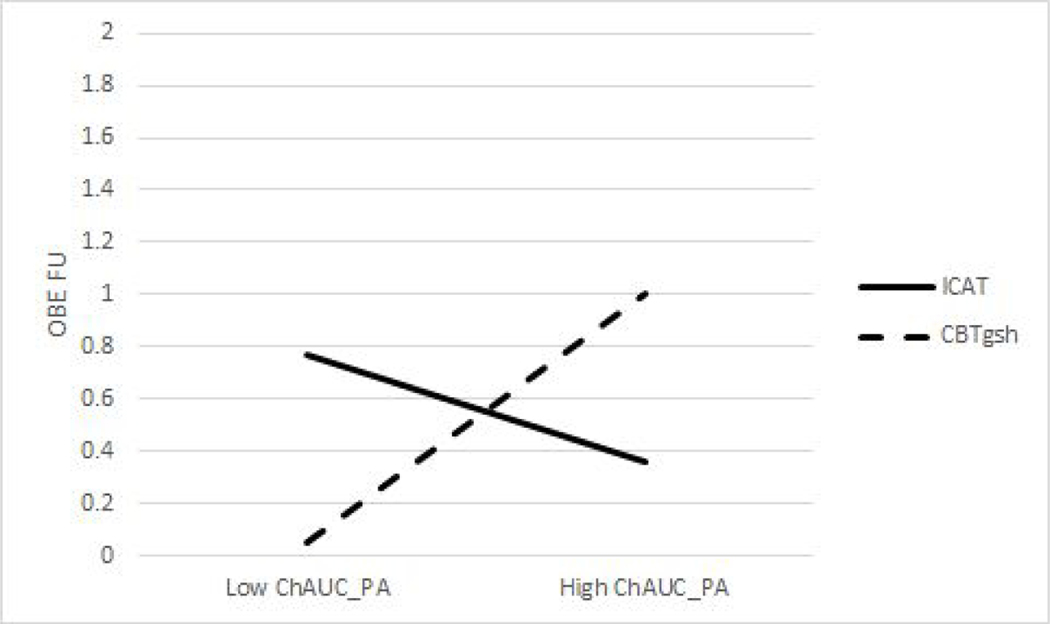
Figure 4.
Interaction of treatment group and change in positive affect (PA) area under the curve (AUC) predicting objective binge eating (OBE) at follow-up (FU). High and low values reflect 1 SD above and below sample means. OBE EOT is binge-eating frequency over the past four weeks controlling for baseline frequency.

