
FIGURE 2.
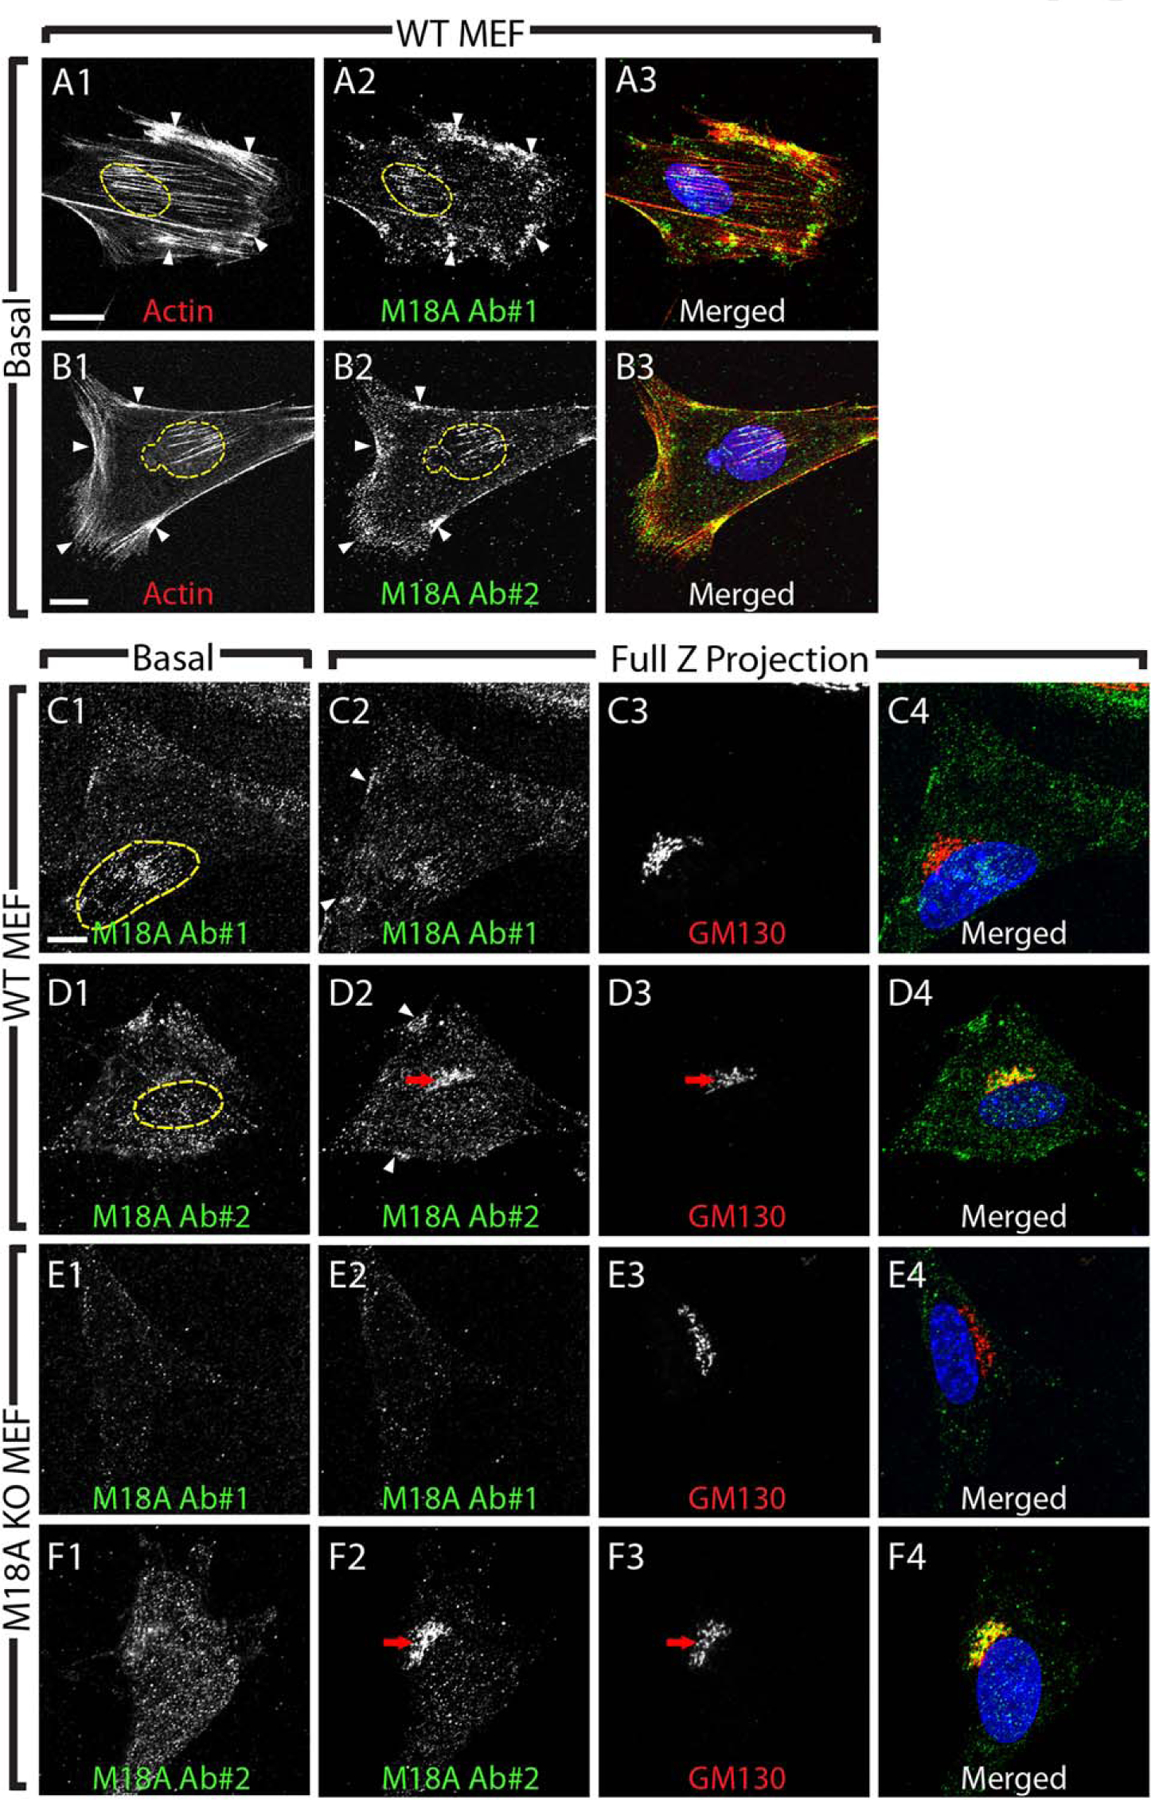
Endogenous M18Aα does not localize to the Golgi. (a) Wild-type (WT) MEF fixed and stained for F-actin (phalloidin, a1) and M18A (Antibody #1, a2). The merged image in (a3) includes the signal for the nucleus (DAPI, blue). The position of the nucleus is marked with a yellow dashed line in (a1 and a2). White arrowheads mark cortical regions where M18A and actin are enriched. The images are maximum intensity projections of the bottom five 0.236 µm slices from a z-stack acquired on a Nikon A1R confocal microscope (“Basal”). Scale bar, 20 µm. (b) Exactly as in (a) except using Antibody #2. (c) WT MEF fixed and stained for M18A (Antibody #1, c1 and c2) and the Golgi (GM130, c3). The merged image in (c4) includes the signal for the nucleus (DAPI, blue). The position of the nucleus is marked with a yellow dashed line in (c1). White arrowheads in (c2) mark cortical regions where M18A and actin are enriched. (c1) is a maximum intensity projection of the bottom five 0.236 µm slices from the full z-stack (“Basal”). (c2–c4) are maximum intensity projections of all 0.236 µm slices acquired on a Nikon A1R confocal microscope (“Full Z Projection”). Scale bar, 10 µm. (d) Exactly as in (c) except using Antibody #2. The apparent co-localization between M18A and the Golgi is marked with red arrows. (e and f) Exactly as in (c and d) except using a M18A KO MEF. Note that the apparent colocalization between M18A and the Golgi (red arrows) seen with Antibody #2 in (d) persists in cells lacking M18Aα and M18Aβ in (f) [Color figure can be viewed at wileyonlinelibrary.com]