
FIGURE 3.
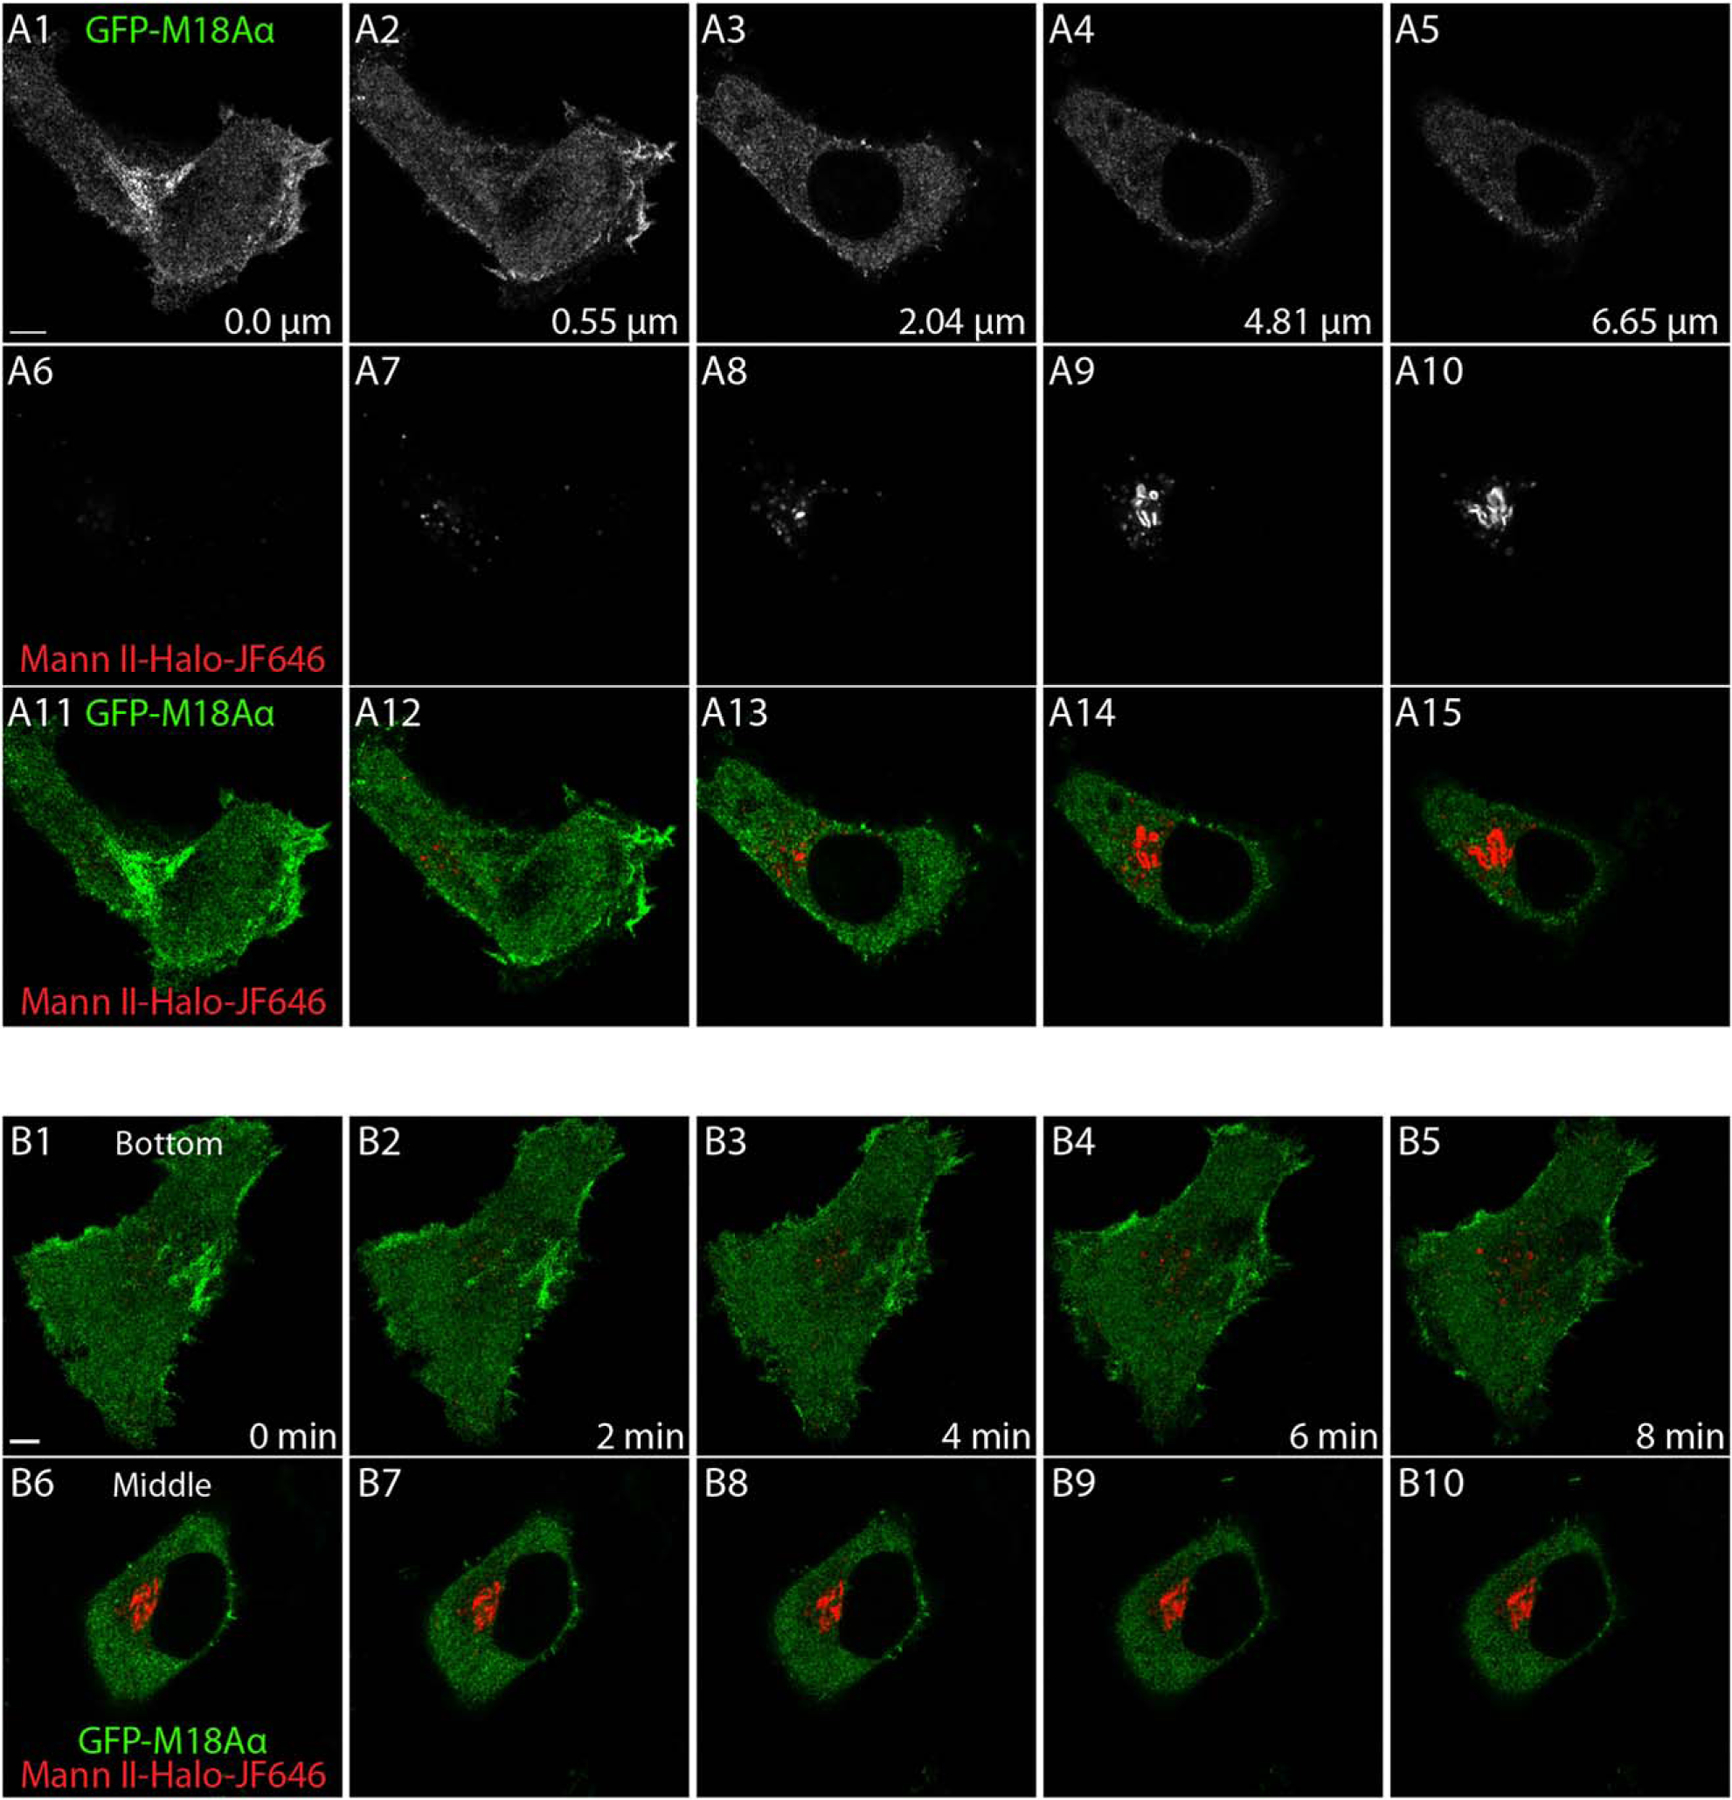
GFP-tagged M18Aα does not localize to the Golgi. (a) HeLa cell expressing EGFP-M18Aα (green) and Mann II-Halo-646 (red) were imaged using a Zeiss Airyscan microscope. Selected optical sections from a complete z-stack are shown from left to right in increasing distance from the cell bottom (distance from the cell bottom indicated in lower right corner of a1–a5). (a1–a5) show M18Aα localization, (a6–a10) show Golgi localization, and (a11–a15) show the merged images. Scale bar, 5 µm. (b) HeLa cell prepared as in (a) was imaged over 8 min in just two planes: at the bottom (b1–b5) and in the middle (3.7 µm above the coverslip) of the cell (b6–b10), and all the panels are merged images of the M18Aα (green) and Golgi (red) at the indicated time points. See also Video S1 in Supporting Information [Color figure can be viewed at wileyonlinelibrary.com]