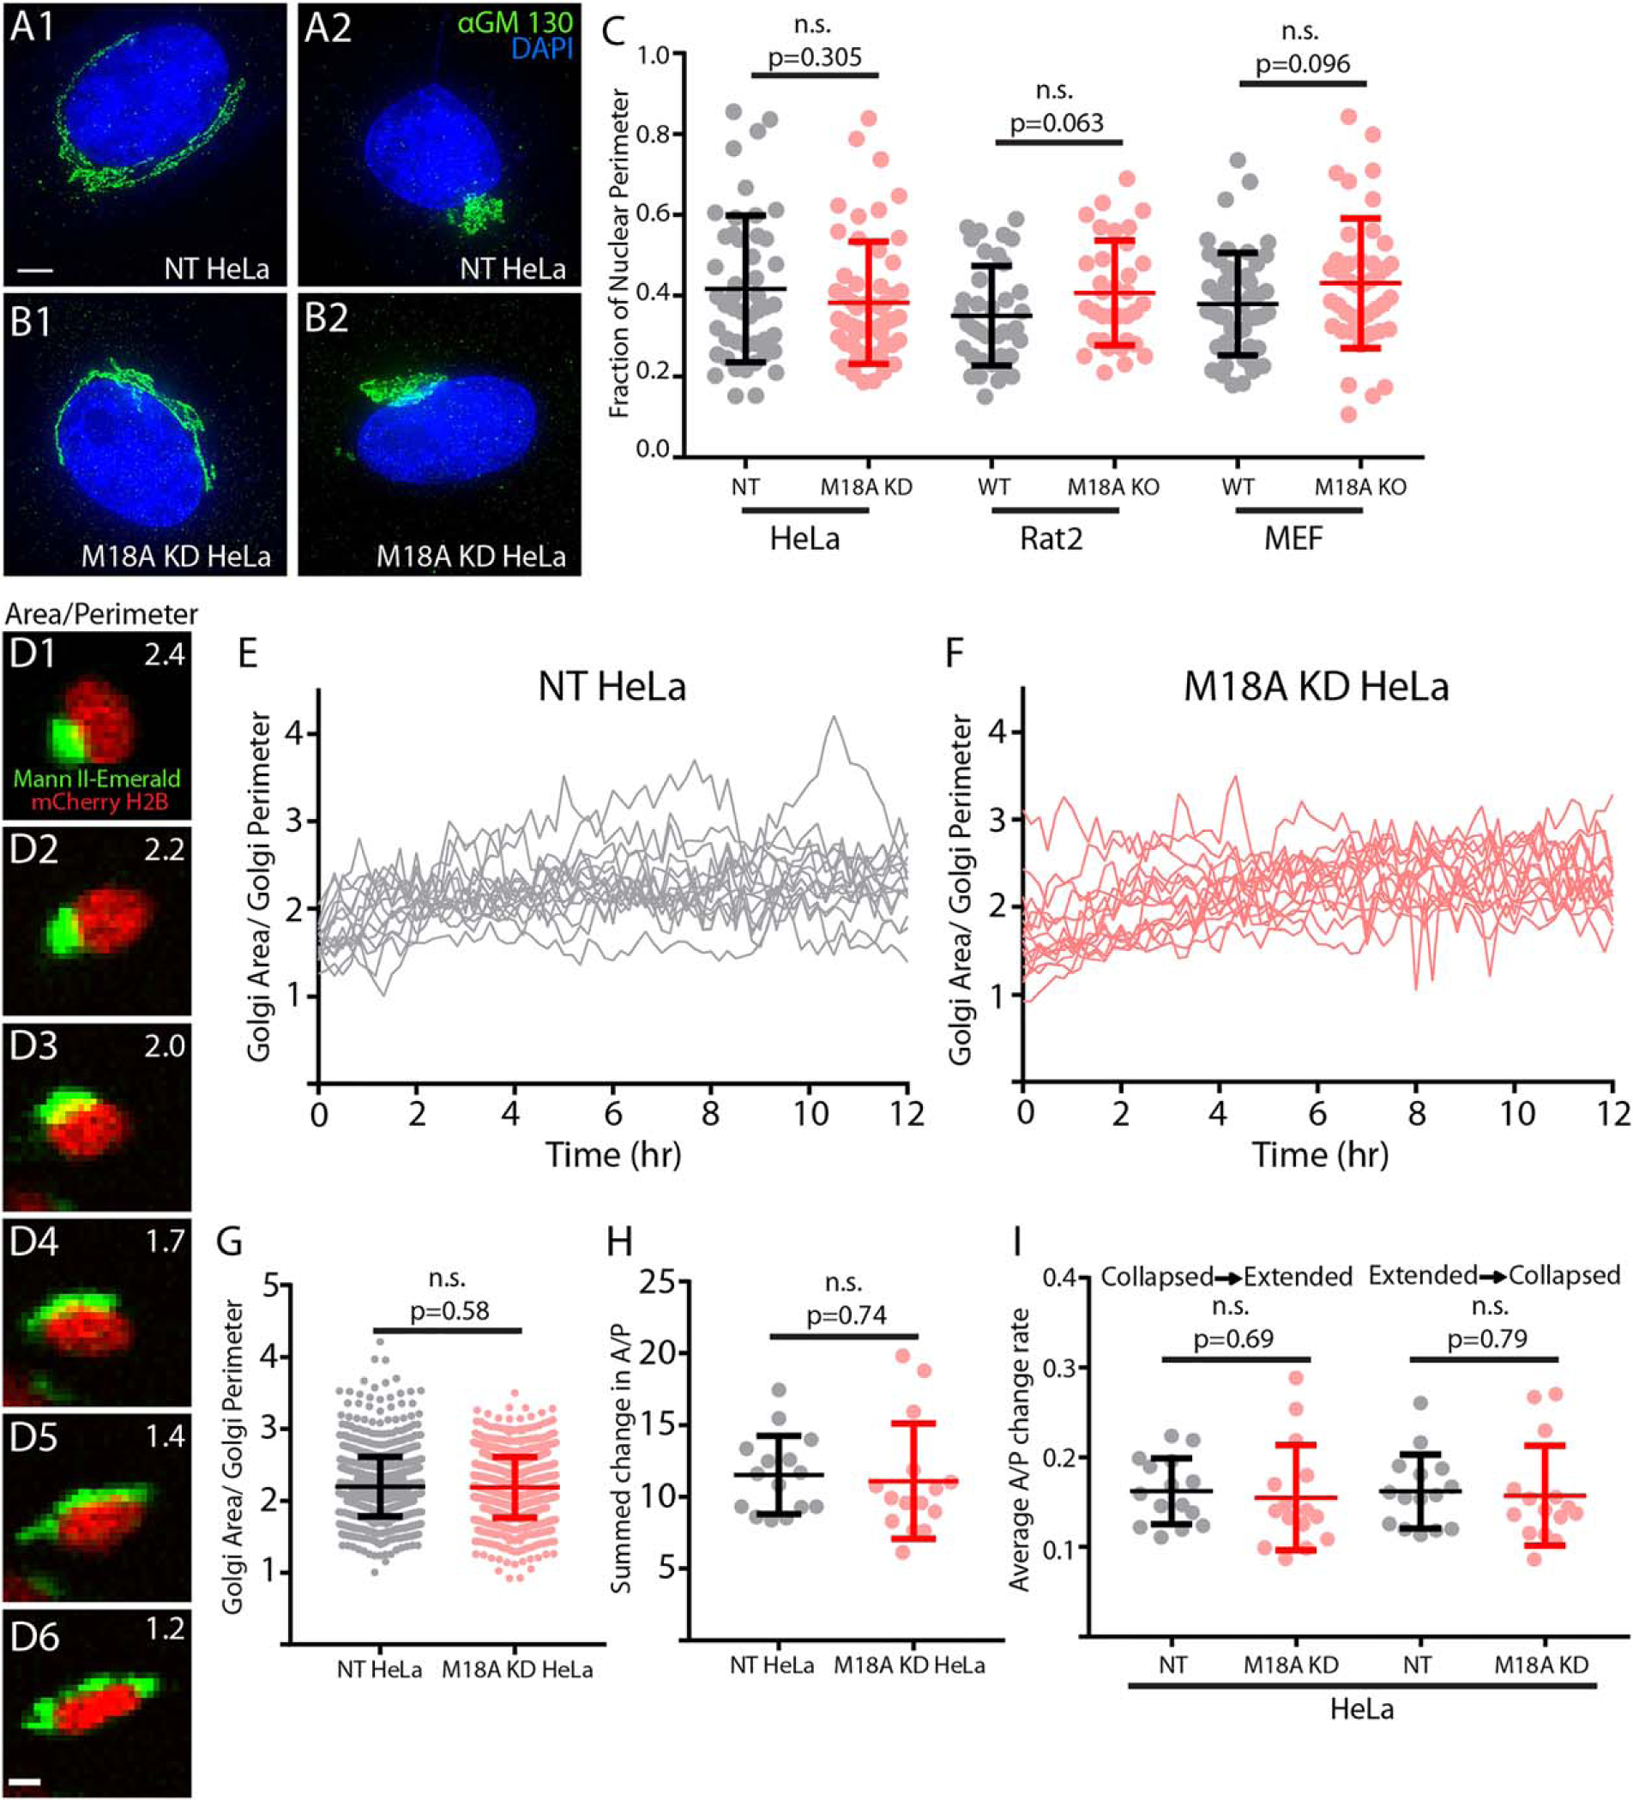
FIGURE 4.

Abrogation of M18Aα expression does not alter Golgi morphology, which is highly variable. (a and b) Control HeLa cells expressing non-targeting (NT) shRNA (NT HeLa, a1 and a2) and Hela cells expressing M18A shRNA (M18A KD HeLa, b1 and b2) were fixed and stained with the cis-Golgi marker α-GM130 (green) and the nuclear marker DAPI (blue). The images are maximum intensity projections of wide-field z-stacks acquired on a Deltavision OMX microscope with 0.125 µm steps. These representative images show that the Golgi can exist in both extended and contracted states in both control and M18A KD cells. Scale bar, 5 µm. (c) Golgi size, quantified as a fraction of nuclear perimeter, was measured in the indicated cell types prepared and was imaged as in (a) and (b). The n values are as follows: NT HeLa (47), M18A KD HeLa (55), WT Rat2 (39), M18A KO Rat2 (49), WT MEF (49), and M18A KO MEF (43). (d) NT HeLa cell expressing mCherry-H2B to mark the nucleus (red) and Mann II-mEmerald to mark the Golgi (green) and was imaged using a Nikon A1R microscope. Shown are representative examples of the variations in Golgi morphology exhibited by this cell over time (A/P values are shown in the upper right corner). Scale bar, 10 µm. (e) A/P values for 15 randomly chosen NT HeLa cells (grey) imaged as described in (d) every 10 min over 12 hr. (f) Exactly as in (e) but with M18A KD HeLa cells (red). (g) Means and standard deviations for all the A/P values obtained over 12 hr for NT HeLa (grey) and M18A KD HeLa (red). (H) Means and standard deviations for the summed changes in A/P values over 12 hr for NT HeLa (grey) and M18A KD HeLa (red). (i) Means and standard deviations for the rates of change in A/P values per 10-min interval going from either collapsed to extended and or from extended to collapsed for NT HeLa (grey) and M18A KD HeLa (red). Where appropriate, p values are indicated (n.s. indicates a lack of significance) [Color figure can be viewed at wileyonlinelibrary.com]
