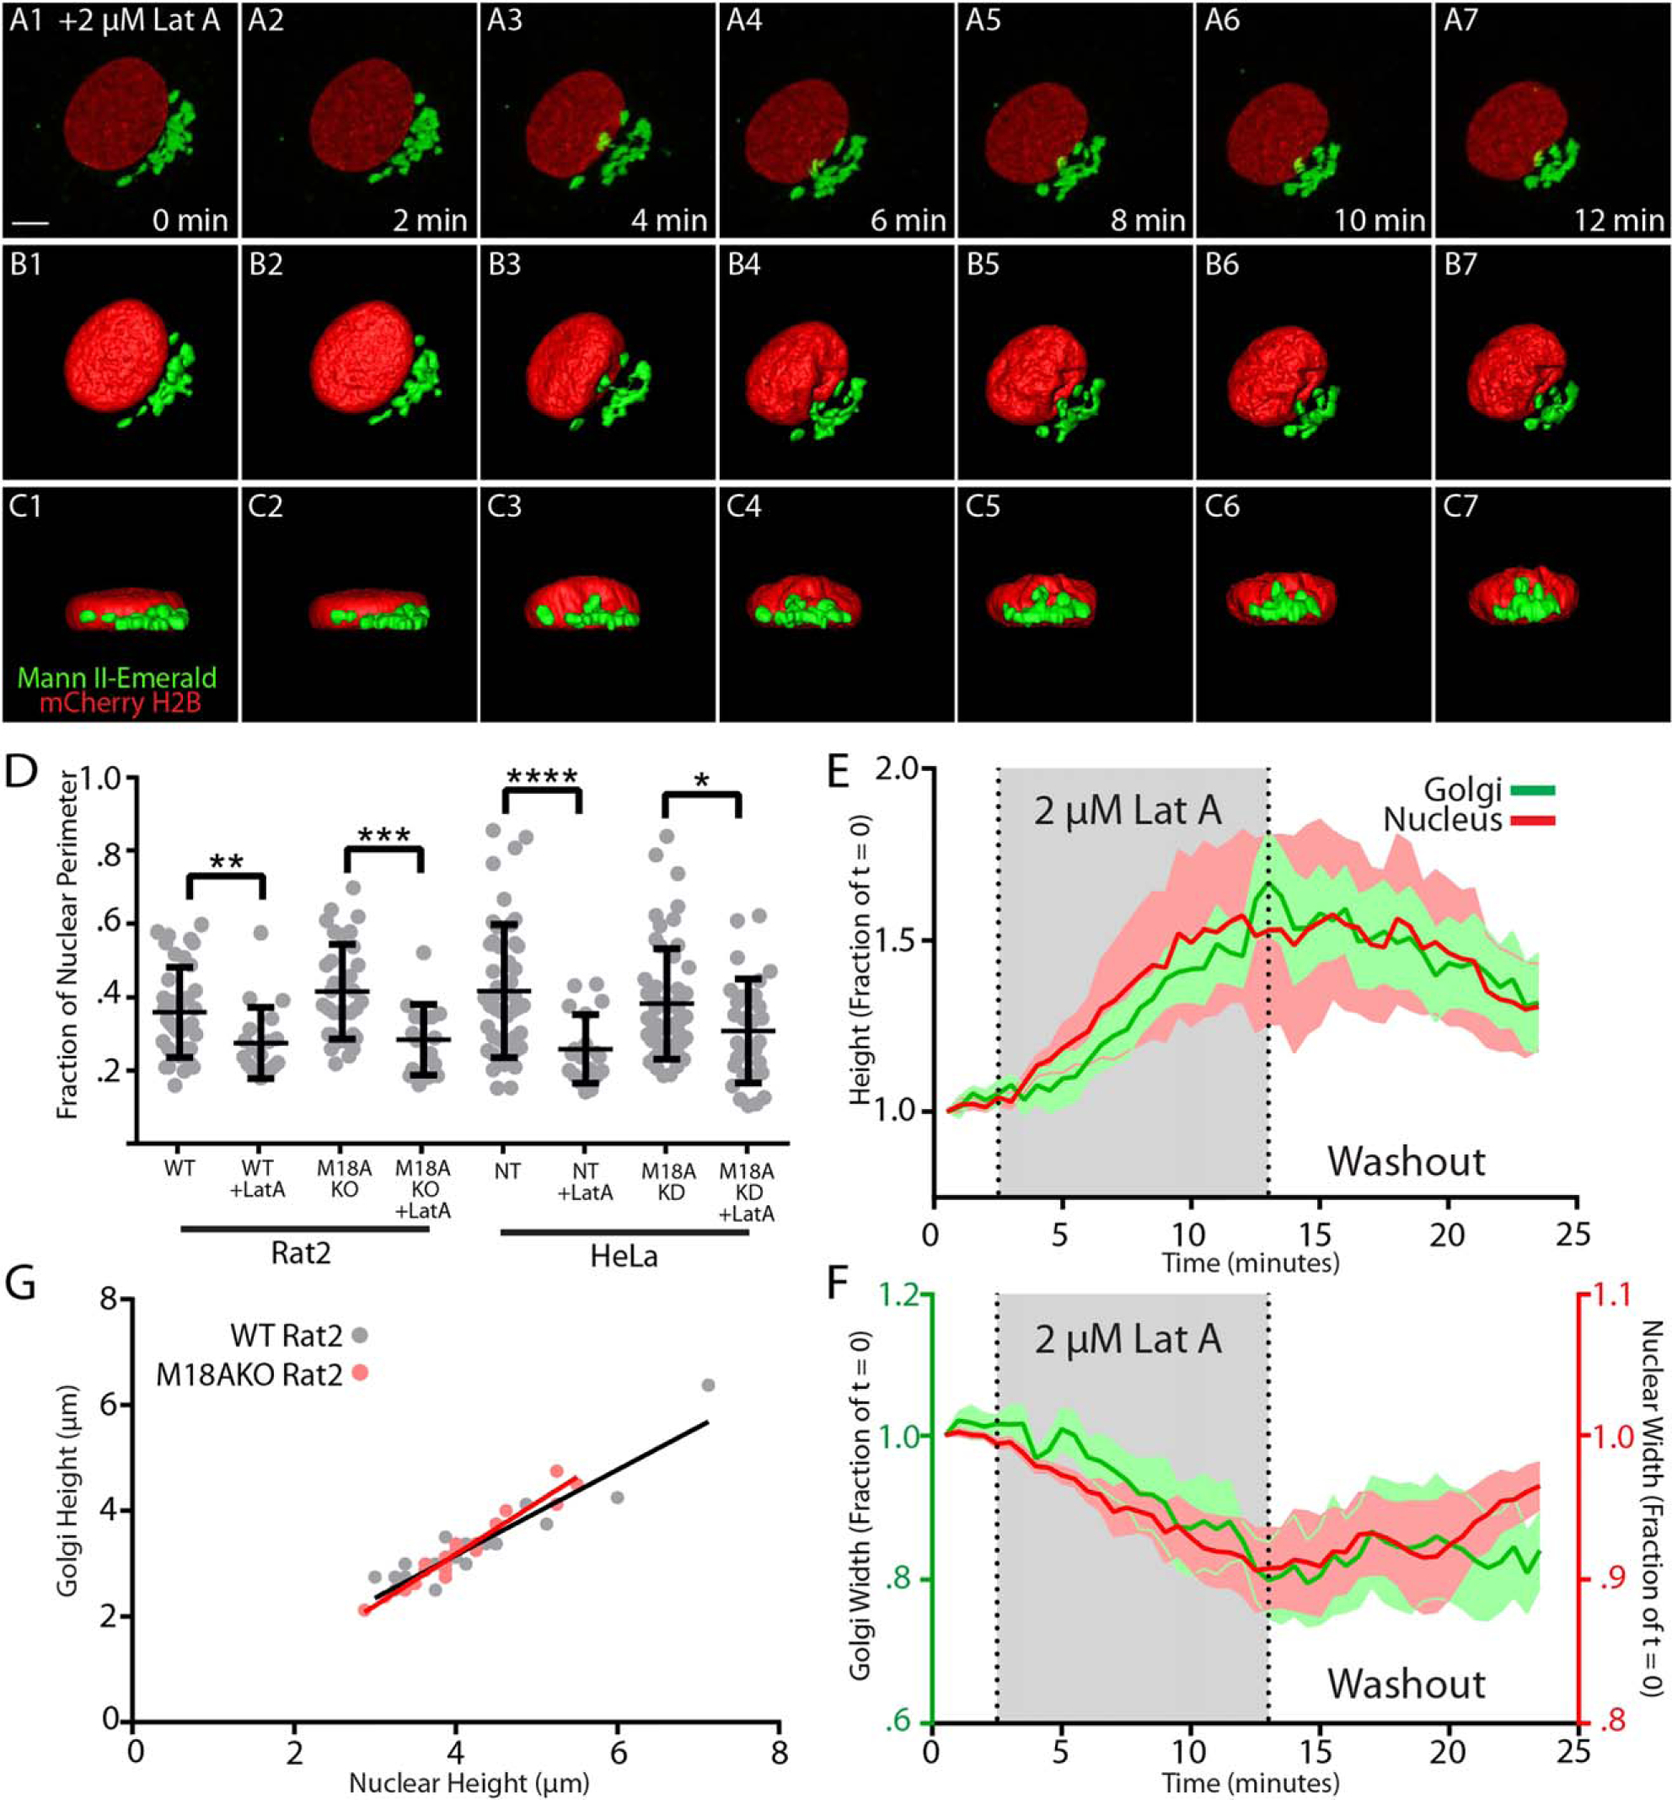
FIGURE 5.

Actin filament disassembly causes changes in Golgi morphology that correlate with changes in nuclear shape. (a–c) A Rat2 cell expressing mCherry-H2B to mark the nucleus (red) and Mann II-mEmerald to mark the Golgi (green) was imaged in 0.5 µm steps on a Zeiss Airyscan microscope every 2-min following addition of 2 µM Lat A (time indicated in lower right corner of a1–a7). Shown are maximum intensity projections from an overhead view (a1–a7), 3D surface-rendered images from an overhead view (b1–b7), and 3D surface-rendered images from an orthogonal view (c1–c7). Scale bar, 5 µm. Note in panels (c1–c7) that as the Golgi undergoes a reduction in width, it increases in height, and that the nucleus undergoes a similar reduction in width and increase in height. See also Video S3 in Supporting Information. (d) Golgi size, quantified as a fraction of nuclear perimeter, measured in the indicated cell types either before or 15 min after addition of 2 µM Lat A, and following fixation and staining with α-GM130 and DAPI. Lines indicate mean +/‒ standard deviation. The p values are as follows: WT Rat2 vs. WT Rat2 + Lat A, p = 0.0073; M18A KO Rat2 vs. M18A KO Rat2 + Lat A, p = 0.0003; NT HeLa vs. NT HeLa + Lat A, p < 0.0001; M18A KD HeLa vs. M18A KD HeLa + Lat A, p = 0.0295. The n values are as follows: WT Rat2 (39), WT Rat2 + Lat A (19), M18A KO Rat2 (34), M18A KO Rat2 + Lat A (16), NT HeLa (47), NT HeLa + Lat A (19), M18A KD HeLa (55), M18A KO HeLa + Lat A (29). (e and f) Eight Rat2 cells expressing Mann II-mEmerald and mCherry-H2B were imaged for 2.5 min prior to Lat A addition, for 10 min in the presence of 2 μM Lat A (grey background), and for 12.5 min after Lat A washout (white background). Panel (e) shows the heights of Golgi (green) and nuclei (red), plotted as fractions of t = 0, while Panel (f) shows the widths of Golgi (green) and nuclei (red), plotted as fractions of t = 0. In both panels, the mean values are indicated by the dark red and green lines, while the SEM values are indicated by the light red and green shaded areas. Note that the scales for Golgi and nuclei in Panel (f) are different. The changes in nuclear and Golgi shape are significantly correlated in both height (R2 = 0.88, p ≤0.0001) and width (R2 = 0.72, p ≤ 0.0001). (g) WT Rat2 cells (grey) and M18A KO Rat2 cells (red) were fixed and stained with the cis-Golgi marker α-GM130 (green) and the nuclear marker DAPI (blue), and the heights of their nuclei (x axis) and Golgi (y axis) measured (n = 23). Linear regression analyses demonstrated a strong positive correlation between Golgi height and nuclear height for both WT (R2 = 0. 86; slope = 0.81) and M18A KO cells (R2 = 0.94; slope = 0.97), and slopes that are significantly nonzero (p ≤ 0.0001) [Color figure can be viewed at wileyonlinelibrary.com]
