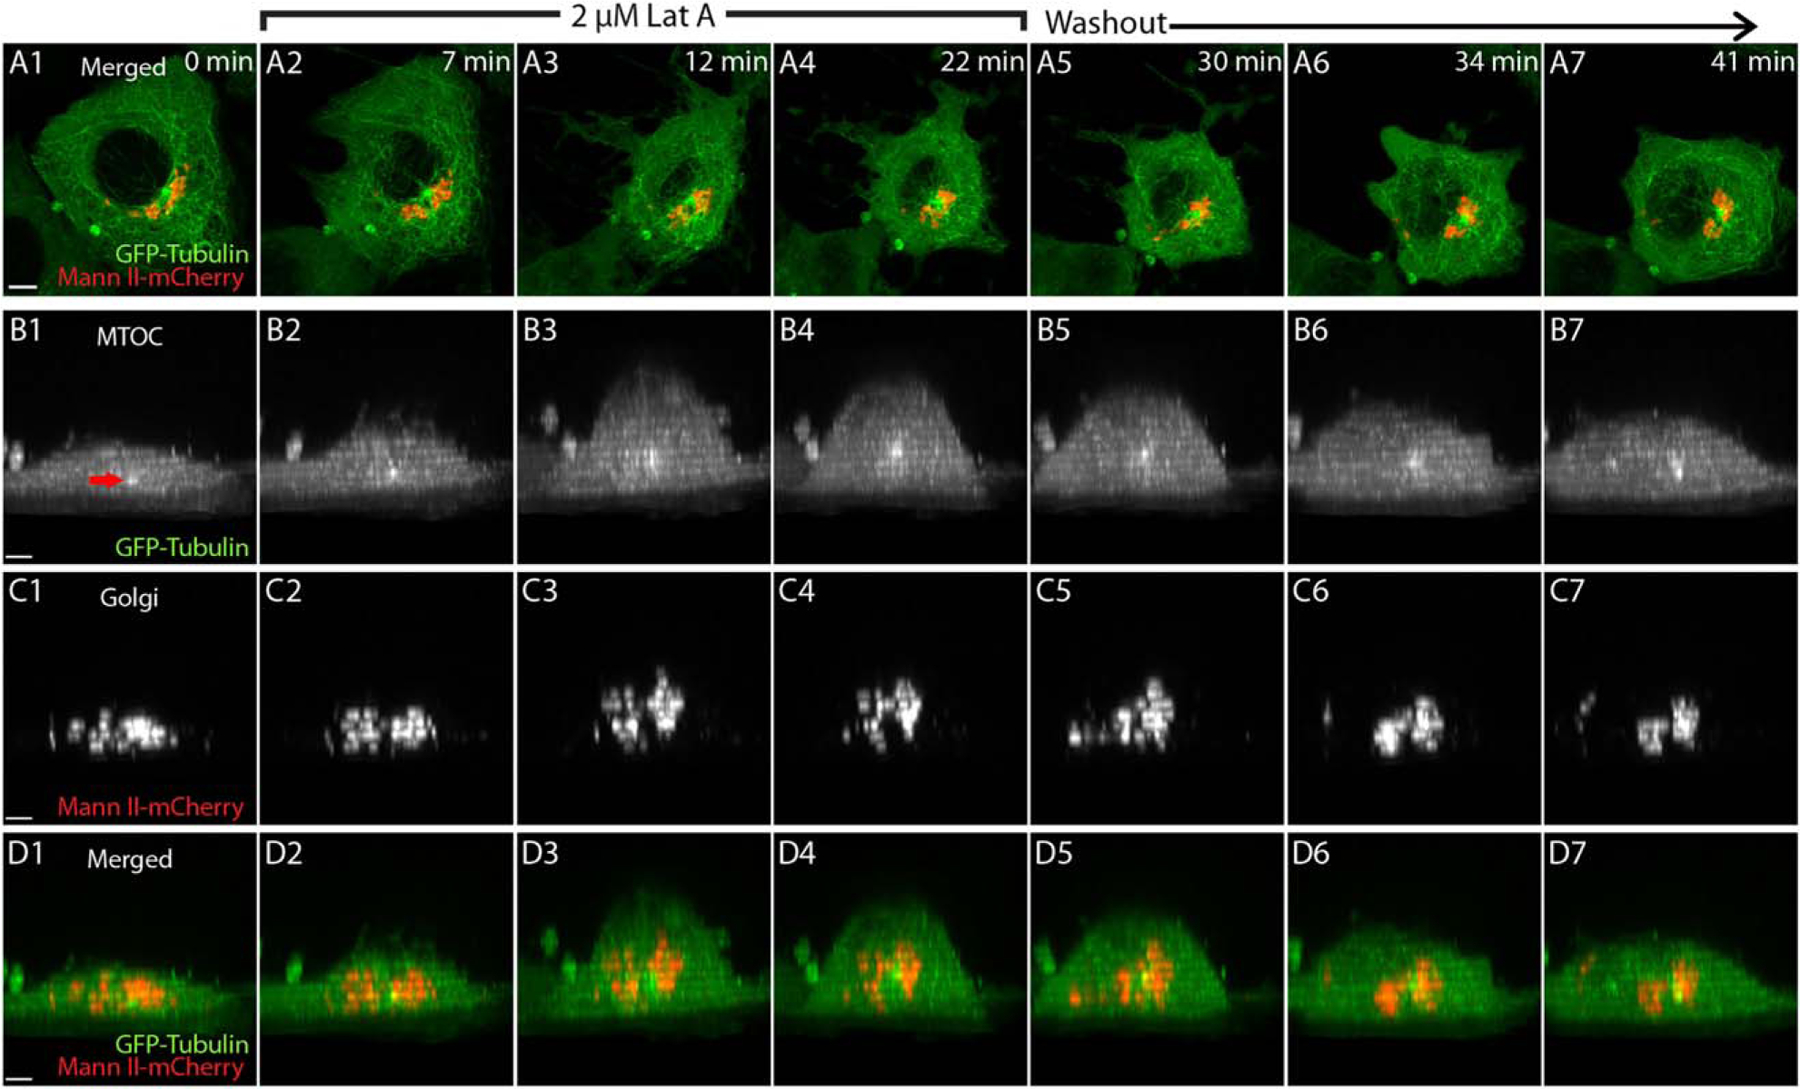
FIGURE 6.

Actin filament disassembly induces vertical movement of the MTOC that parallels the increase in Golgi height. (a–d) A Rat2 cell expressing GFP-tubulin to mark the MTOC (the single, bright, perinuclear green spot marked with a red arrow in Panel b1) and Mann II-mCherry to mark the Golgi (red) was imaged in 1 µm steps on a Zeiss Airyscan microscope at the indicated time points (upper right corner in a1–a7) before, during, and after treatment with 2 µM Lat A, as indicated. Shown are maximum intensity projections for the merged images from an overhead view (a1-a7), and maximum intensity projections for the MTOC (b1-b7, see arrowhead), Golgi (c1-c7), and merged (d1-d7) from orthogonal views. See also Video S4 in Supporting Information. The horizontal striping apparent in the orthogonal views stems from the suboptimal axial sampling required to execute super-resolution imaging and can be ignored. Scale bars, 4 µm in (a) and 3 µm in (b–d) [Color figure can be viewed at wileyonlinelibrary.com]
