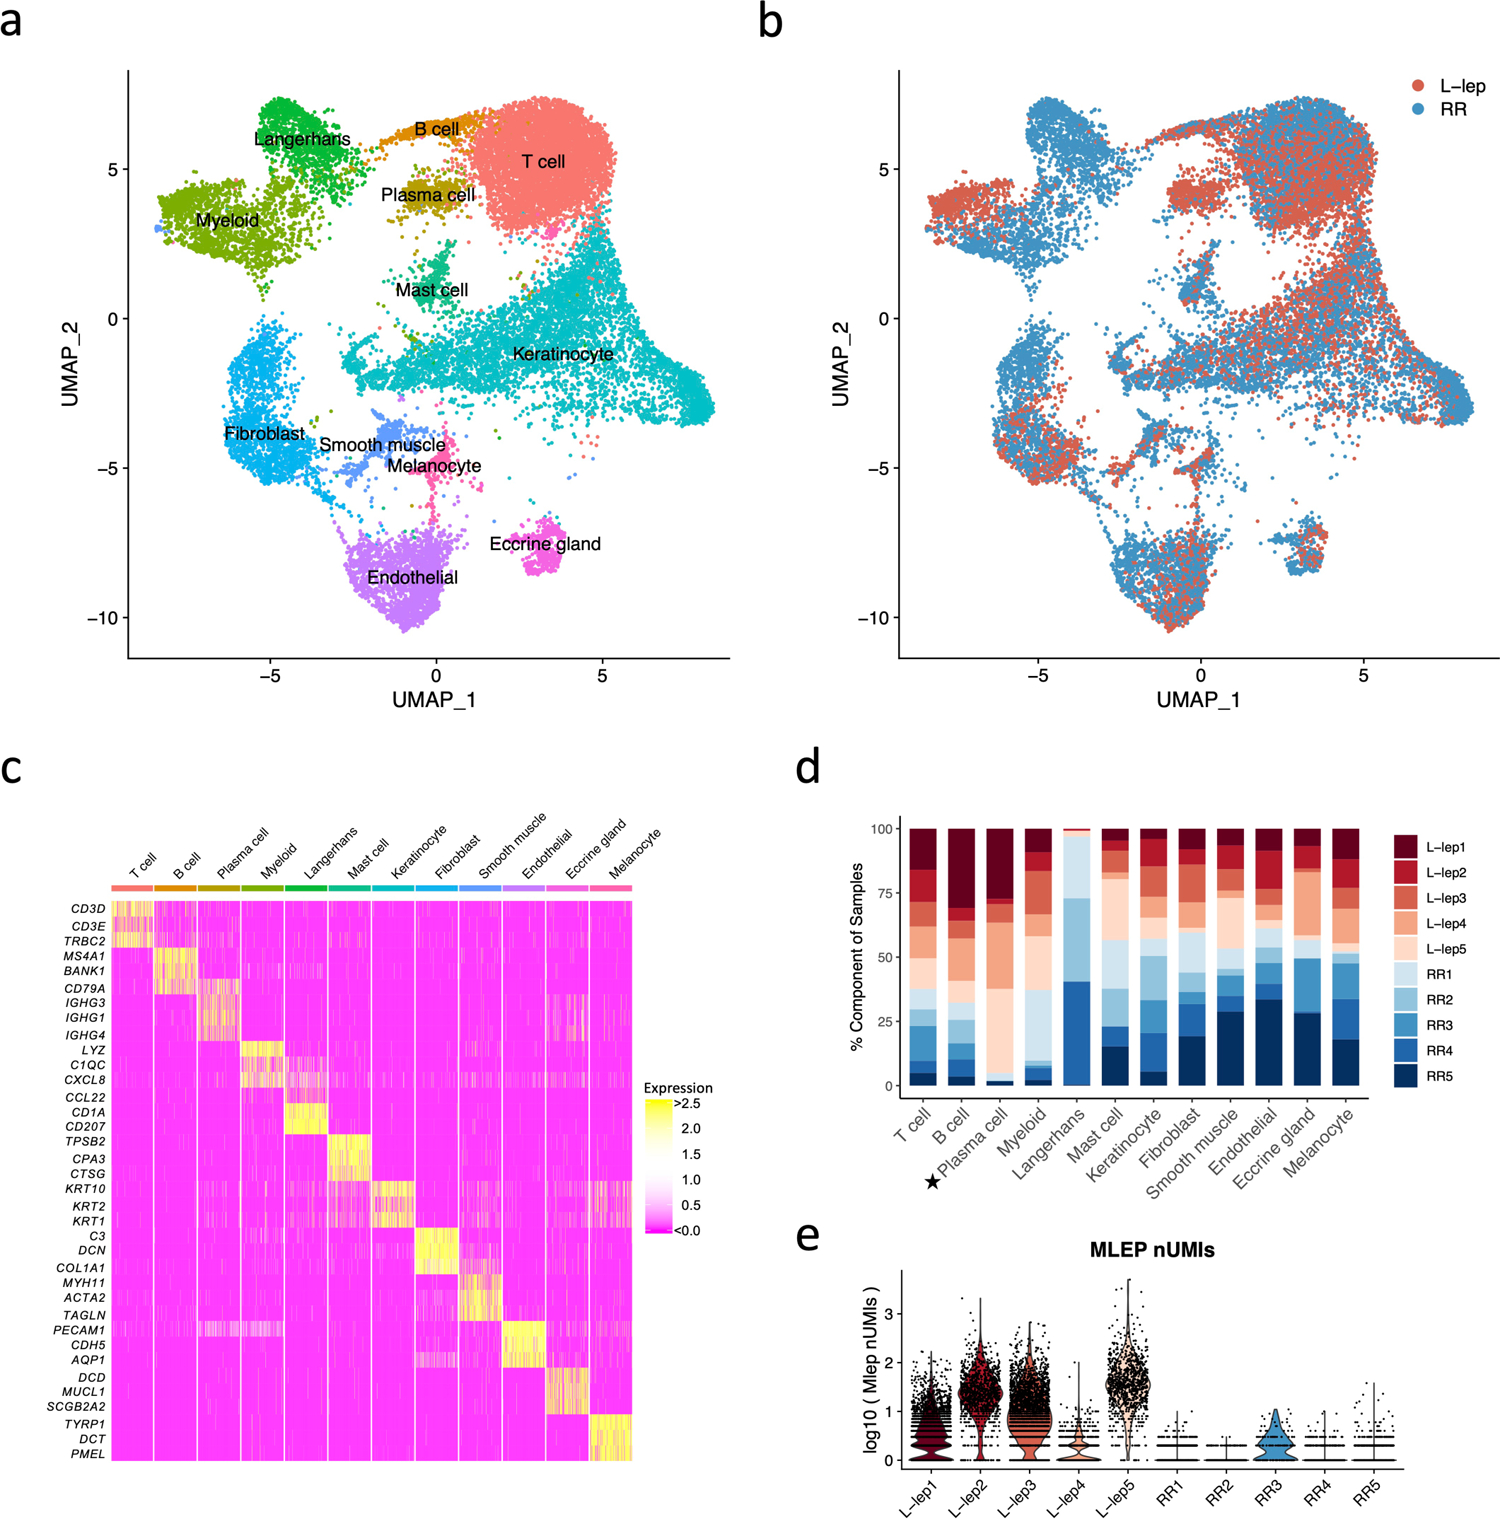
Fig. 1. Cell types observed in leprosy lesions.

a. UMAP plot for 21,318 cells colored by cell types.
b. UMAP plot colored by clinical forms.
c. Heatmap showing three representative marker genes for each cell type.
d. Abundance composition across all samples for each cell type. T tests were conducted between the L-lep and RR samples for each cell type (excluding the Langerhans cells), only plasma cells had a p value <0.05.
e. Violin plot showing the number of M. leprae transcripts detected in individual cells from each patient.
