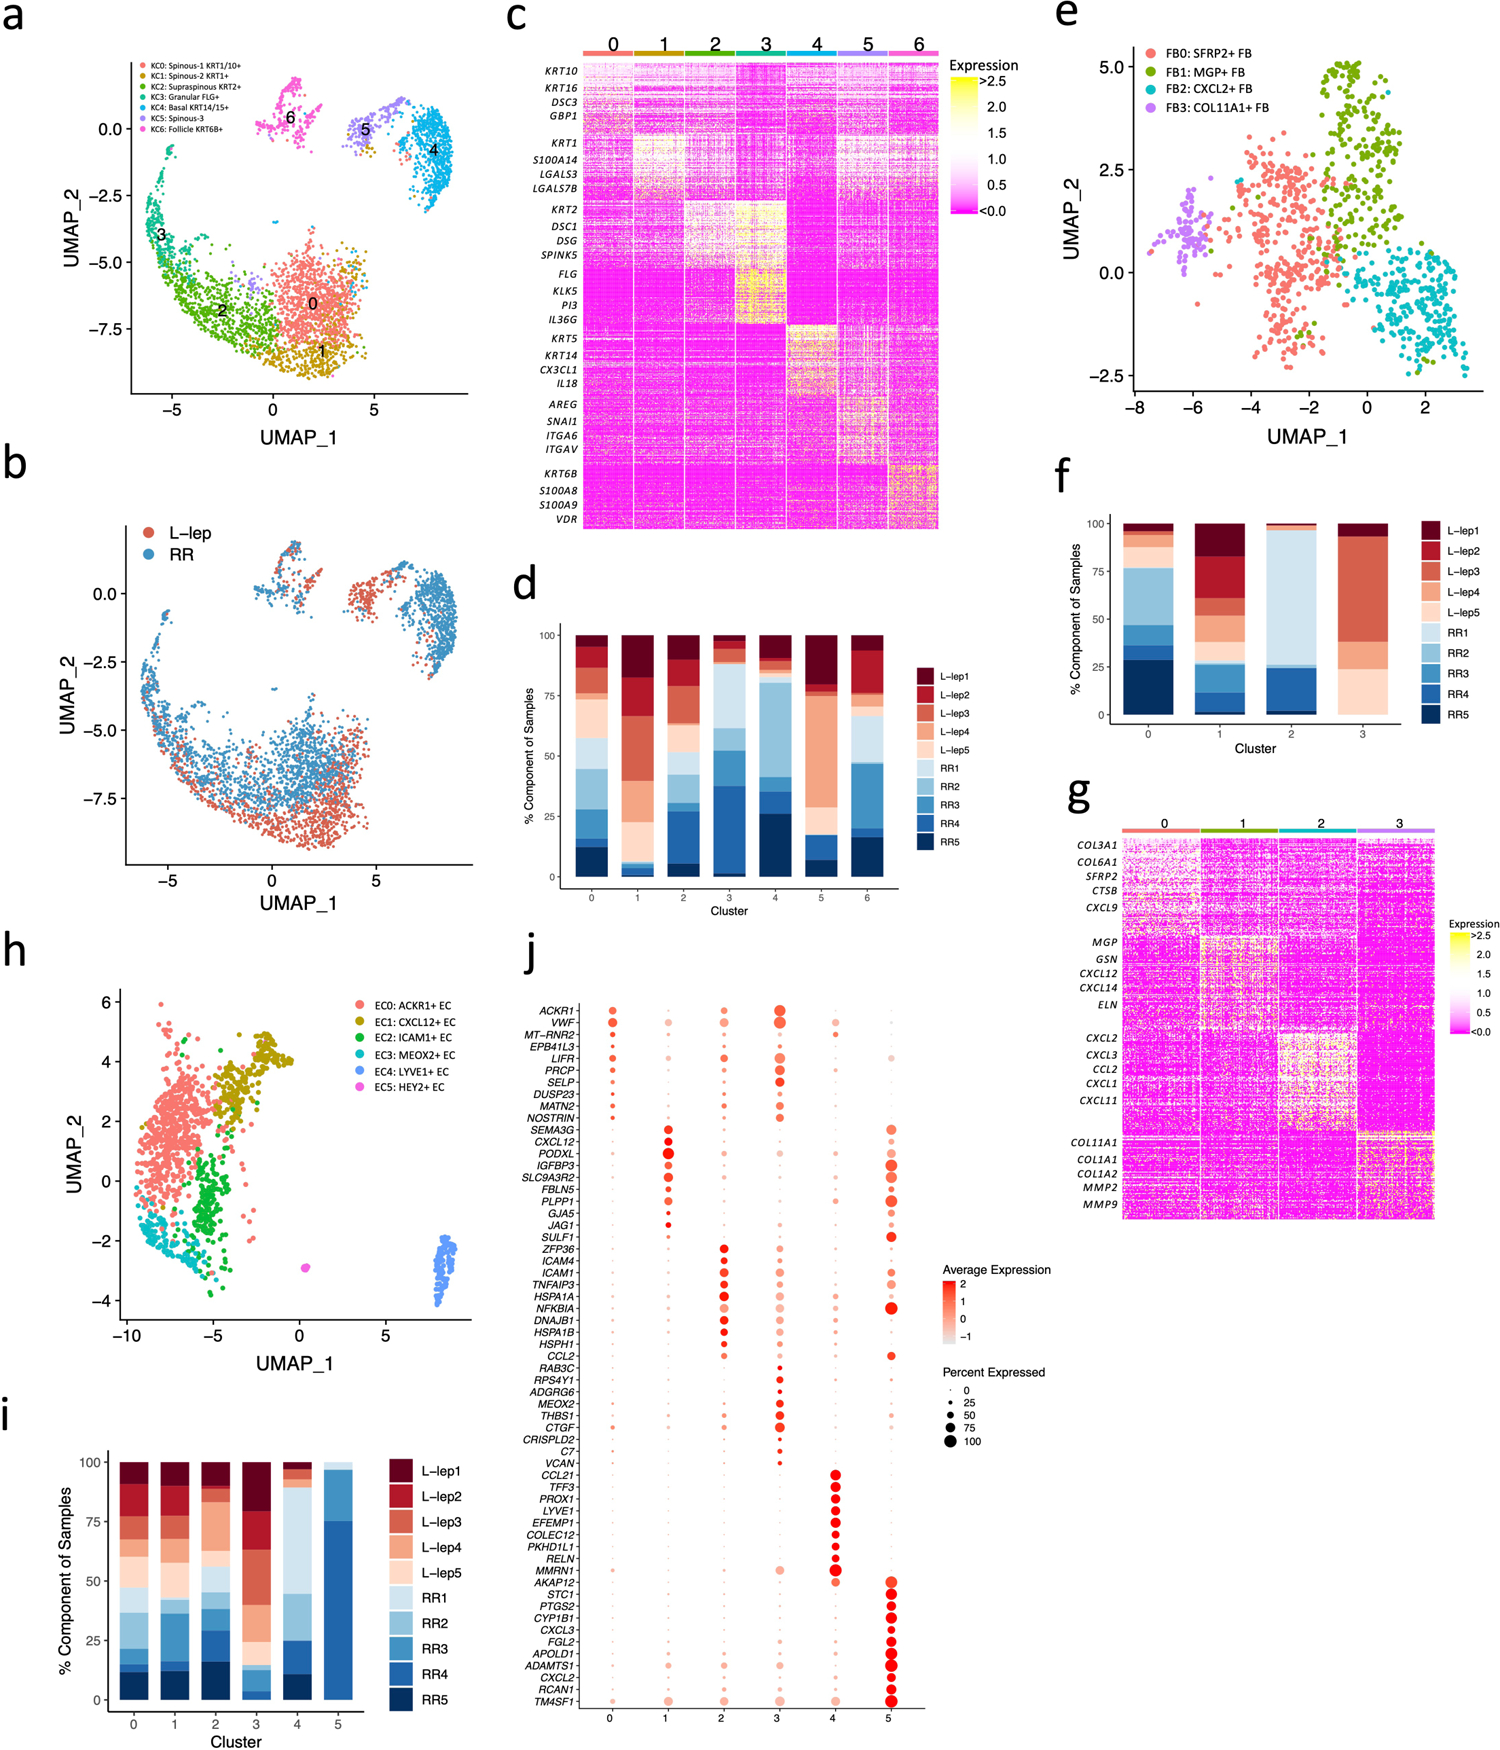
Extended Data Fig. 3. Identification of keratinocyte subtypes.

a. UMAP plot for 3,748 keratinocytes colored by subtypes.
b. UMAP plot for 3,748 keratinocytes colored by clinical forms.
c. Heatmap showing marker genes for each keratinocyte subtype. The representative genes are labelled.
d. Abundance composition across all samples for each keratinocyte subtype.
e. UMAP plot for 1,010 fibroblasts colored by subtypes.
f. Abundance composition across all samples for each fibroblast subtype.
g. Heatmap showing marker genes for each fibroblast subtype. The representative genes are labelled.
h. UMAP plot for 1,219 endothelial cells colored by subtypes.
i. Abundance composition across all samples for each endothelial cell subtype.
j. Dot plot showing 10 marker genes for each endothelial subtype. The color scale represents the scaled expression of the gene. The size of the dot represents the percentage of cells expressing the gene.
