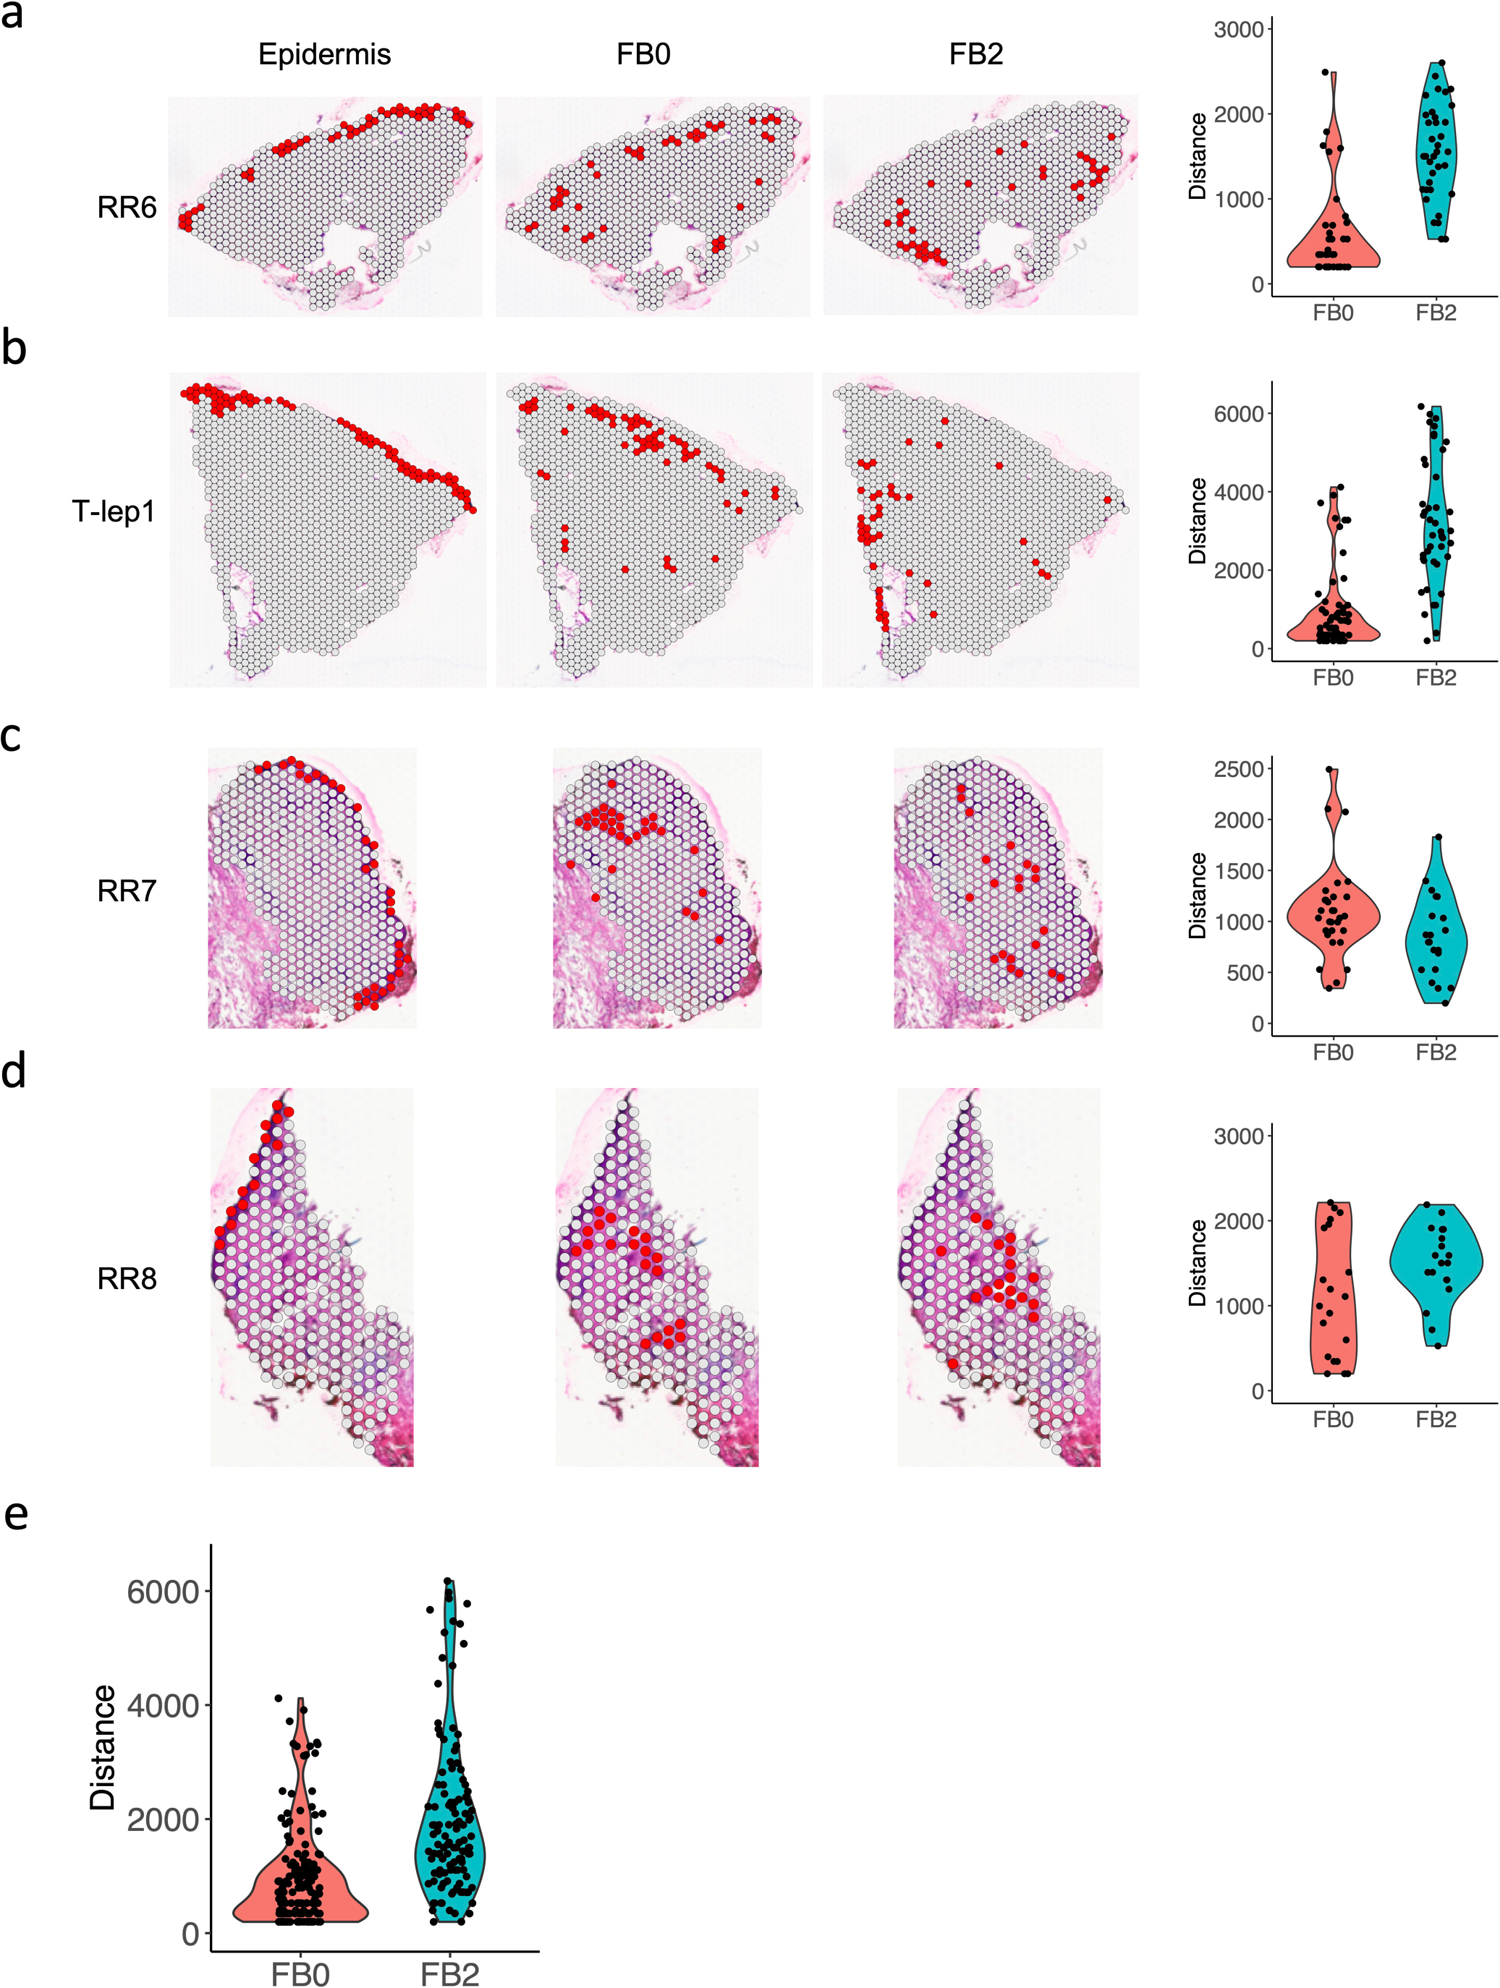
Extended Data Fig. 8. Spatial distance between the FB0 and FB2 sub-clusters and the epidermis in the RR and T-lep samples.

a. Spatial plots showing the identified epidermis, FB0 and FB2 spots in the RR6 sample (left). Violin plot showing the distance of each FB0 and FB2 spot to the nearest epidermis spot.
b. Spatial plots showing the identified epidermis, FB0 and FB2 spots in the T-lep1 sample (left). Violin plot showing the distance of each FB0 and FB2 spot to the nearest epidermis spot.
c. Spatial plots showing the identified epidermis, FB0 and FB2 spots in the RR7 sample (left). Violin plot showing the distance of each FB0 and FB2 spot to the nearest epidermis spot.
d. Spatial plots showing the identified epidermis, FB0 and FB2 spots in the RR8 sample (left). Violin plot showing the distance of each FB0 and FB2 spot to the nearest epidermis spot.
e. Violin plot showing the distance of each FB0 and FB2 spot to the nearest epidermis spot in all three RR and the T-lep spatial-seq samples. The p value (1.32e-14) was calculated from a two-sided Wilcoxon rank sum test (152 FB0 spots vs 120 FB2 spots).
