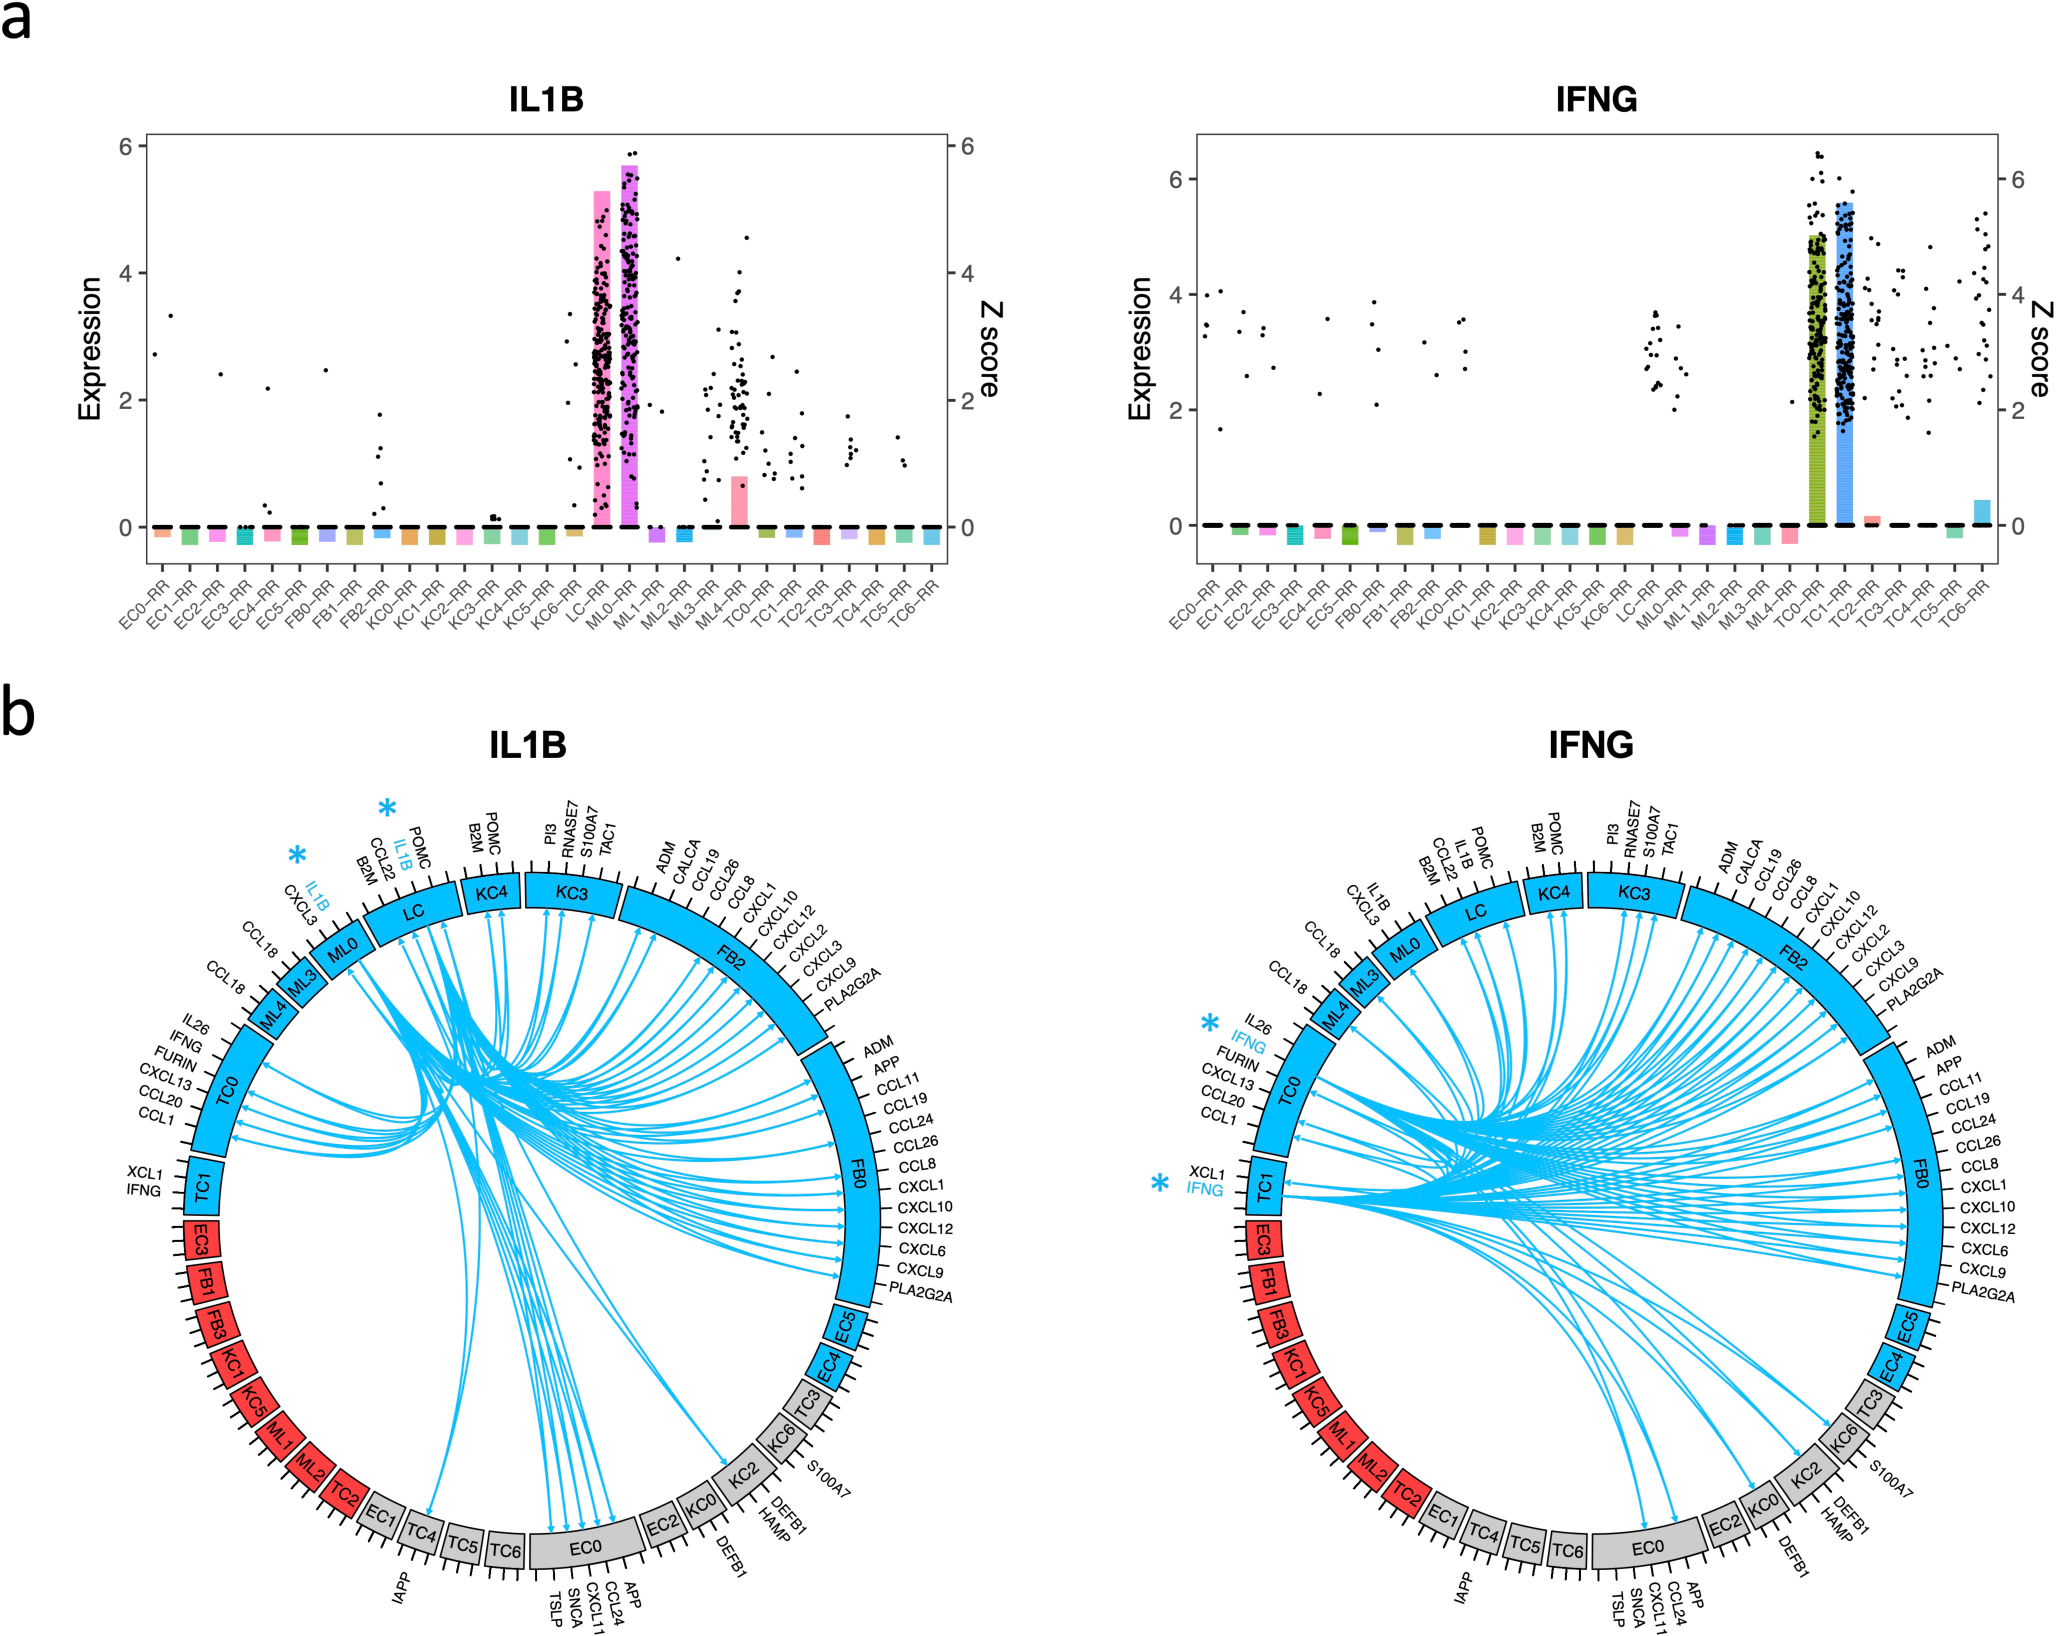
Fig. 5. Antimicrobial network induced by IL1B and IFNG.

a. Bar plot showing the z scores of IL1B (left) or IFNG (right) expression levels in each cell type from RR lesions. The dots represent IL1B or IFNG expression level in individual cells.
b. Circos plot showing the connection between IL1B (left) or IFNG (right) and the direct antimicrobial gene targets in the cell types with z score >3. The color represents patient composition of the cell type. Red: L-lep specific; Blue: RR specific; Grey: mix of L-lep and RR.
