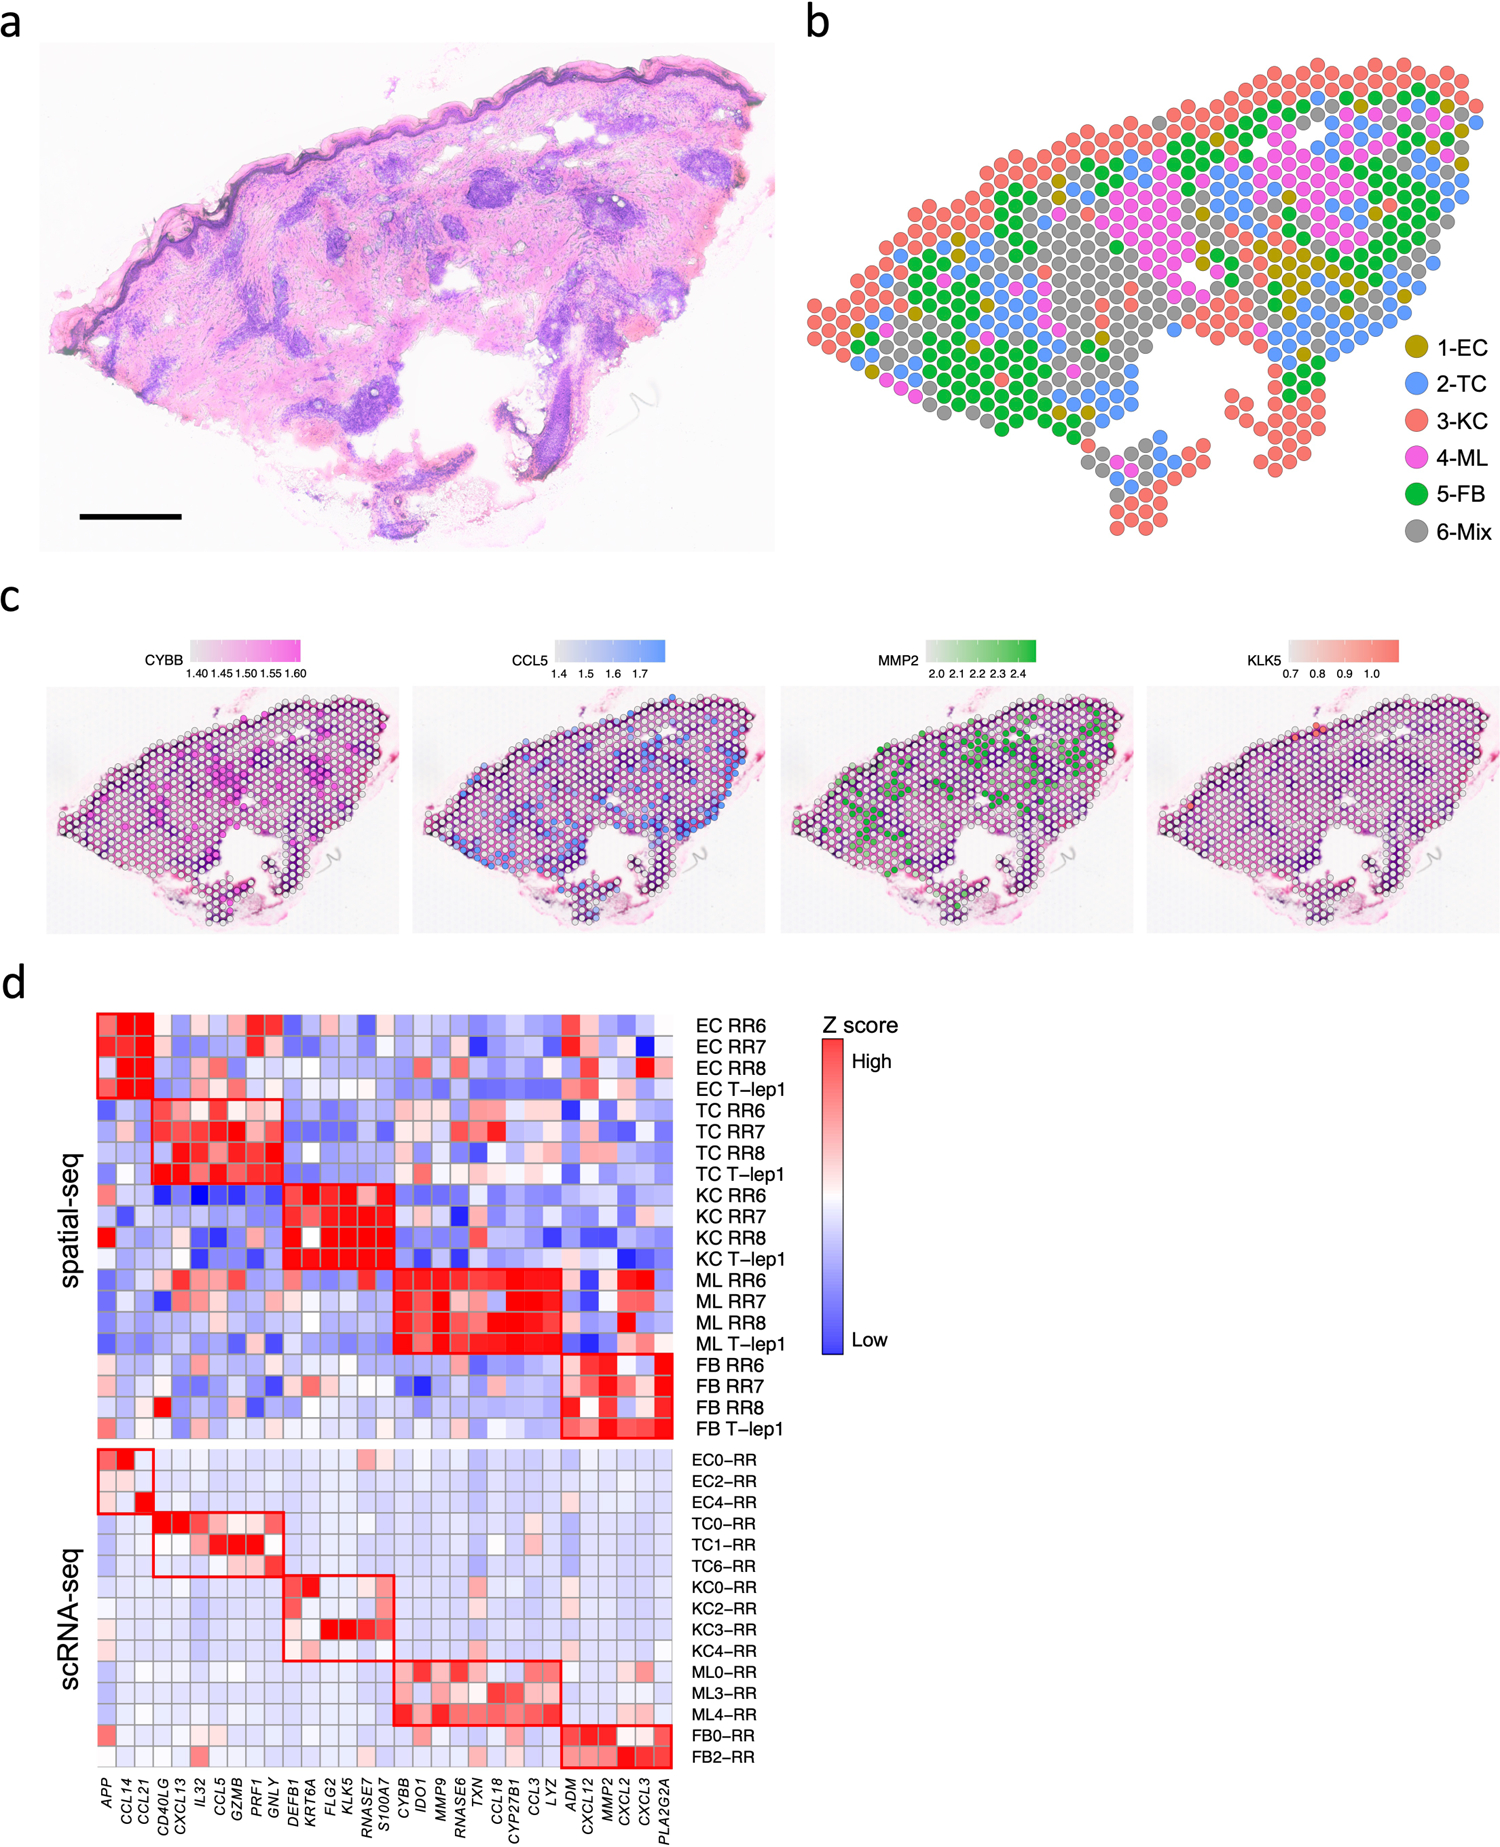
Fig. 6. Spatial sequencing recapitulates the same set of antimicrobial genes in the corresponding cell types.

a. H & E staining of the RR6 biopsy used for spatial sequencing. Scale bar: 0.5 mm.
b. Spatial plot for 708 spots colored by clusters, the coordinates of the spot correspond to the location in the tissue.
c. Spatial plots showing expression level of four antimicrobial genes. The colors correspond to the cluster colors in B. CYBB was highly expressed in myeloid cells, CCL5 in T cells, MMP2 in fibroblasts and KLK5 in keratinocytes.
d. Heatmaps showing 31 antimicrobial genes expressed in the same cell types in both spatial-seq and scRNA-seq. All the RR and T-lep spatial-seq samples were plotted. The red boxes indicate distinct sets of antimicrobial genes highly expressed in a certain cell-type. RR: reversal reaction; T-lep: borderline tuberculoid.
