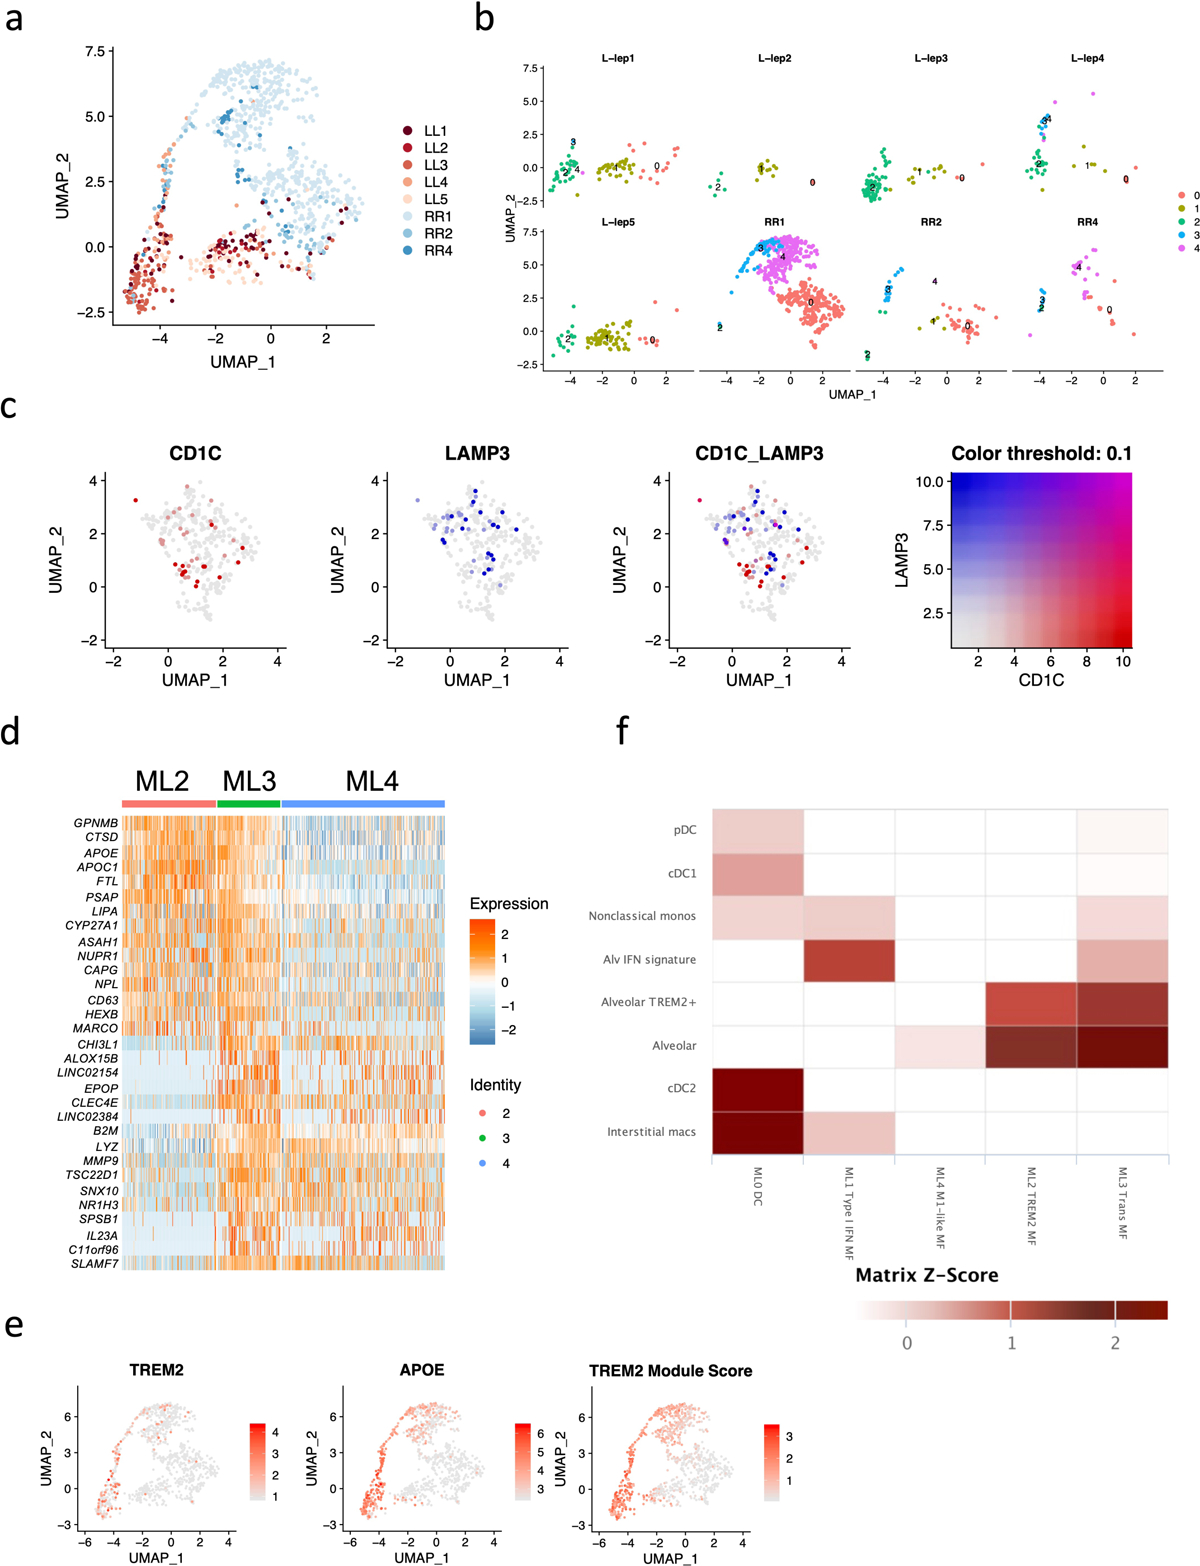
Extended Data Fig. 2. Dendritic cell subpopulations and comparison of macrophage sub-clusters.

a. UMAP plot for 991 myeloid cells colored by patient identities.
b. Individual UMAP for the myeloid cells from each patient.
c. UMAP plots showing CD1C and LAMP3 expression in ML0. Only few co-expression events were observed, indicating distinct dendritic cell subpopulations.
d. Heatmap showing top differentially expressed genes between ML2 and ML4. ML3 expressed both ML2 and ML4 specific genes.
e. UMAP plots showing TREM2 expression, APOE expression and TREM2 module score. The color scale represents the expression level of the genes or the level of the module score.
f. Myeloid cell subtype comparisons between scRNA-seq data sets from human leprosy skin biopsy specimens and from lung samples of a non-human primate model of tuberculosis. The color scale represents the z scores of the gene expression signature scores.
