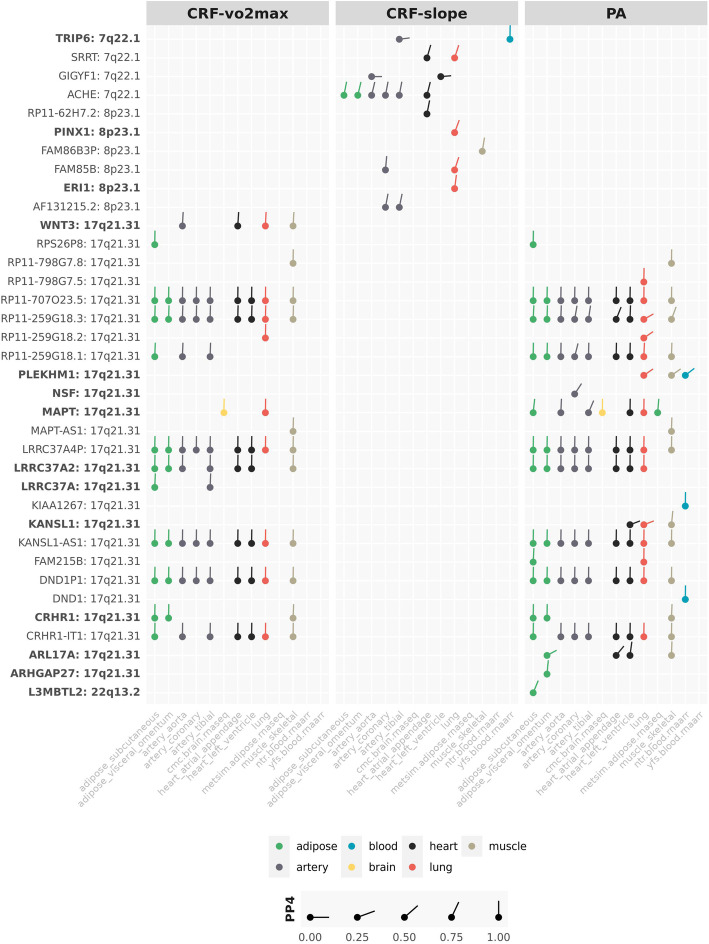
Fig. 4.
TWAS and colocalisation-identified genes. Genes listed on the y-axes are significant at the conservative Bonferroni-corrected TWAS p value. On the x-axis is tissue type; the category of the tissue is represented by colour, colocalisation posterior probability 4 (COLOC PP4—the probability of a shared causal SNP driving the association signal and expression in a reference tissue) represented by line angle (the vertical line is a probability of 1.0 that the GWAS-identified SNP is an eQTL for the gene). The complementary TWAS and colocalisation approaches provide a priority list of genes for further exploration. Genes in bold were significant in the gene-based test of association

