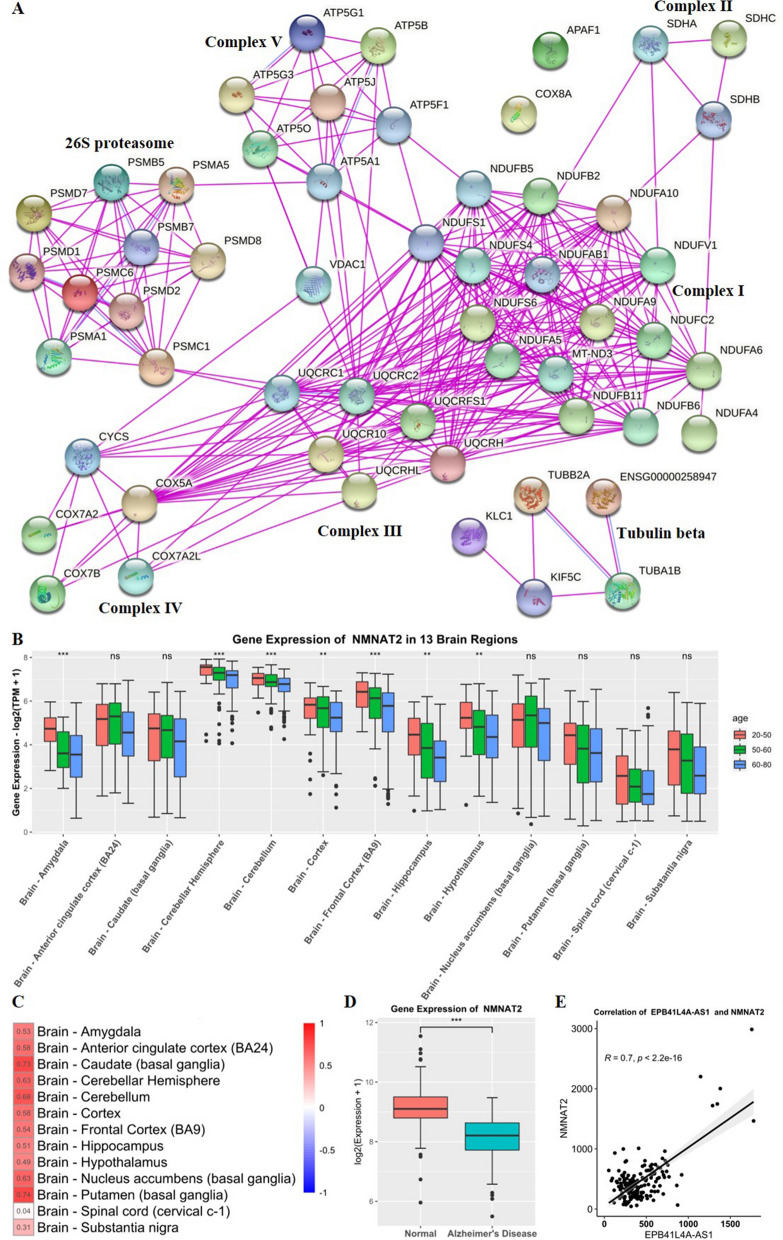
Fig. 4.
PPI network for 55 PCGs and analysis of the regulation of EPB41L4A-AS1 on NMNAT2. A PPI network for 55 PCGs from experiments, 55 PCGs are main components of complex I—complex V. B Gene expression of NMNAT2 in 13 brain regions with different ages. C Correlation of EPB41L4A-AS1 and NMNAT2 in 13 brain regions, the values of the correlation coefficients are also represented by color; red color represents a positive correlation while blue color represents a negative correlation. D Gene expression of NMNAT2 in normal and AD samples. E Correlation of EPB41L4A-AS1 and NMNAT2 in normal and AD samples

