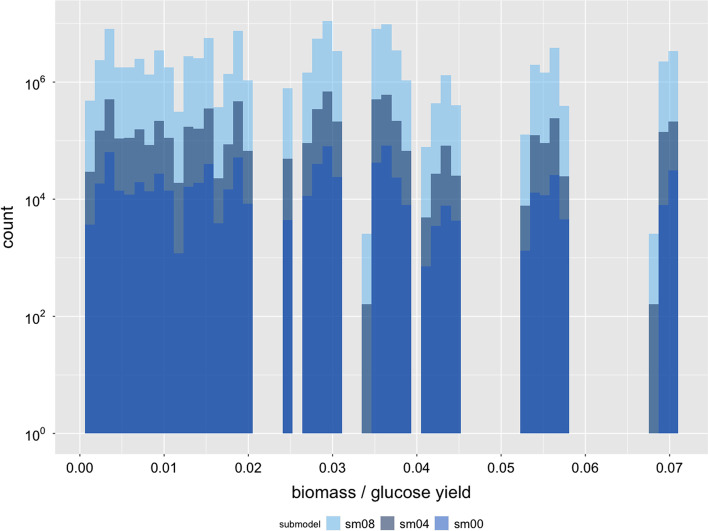
Fig. 7.
Histogram of the biomass / glucose yield for the sub-models , and of JCVI-syn3A [31]. The x-axis shows the yield and the y-axis the count in logarithmic scale. The sub-models are plotted in different colors on top of each other with the smallest sub-model in dark blue in the top, sub-model in gray in the middle and the largest sub-model in light blue in the bottom layer. The factor between and is exactly 16 over the complete distribution, the factor between and is 8.6 and 138.3 between and . This shows that the bigger sub-models completely include all previous smaller sub-models and that additional carbon sources do not lead to new metabolic pathways, but rather integrate into and reinforce existing structures

