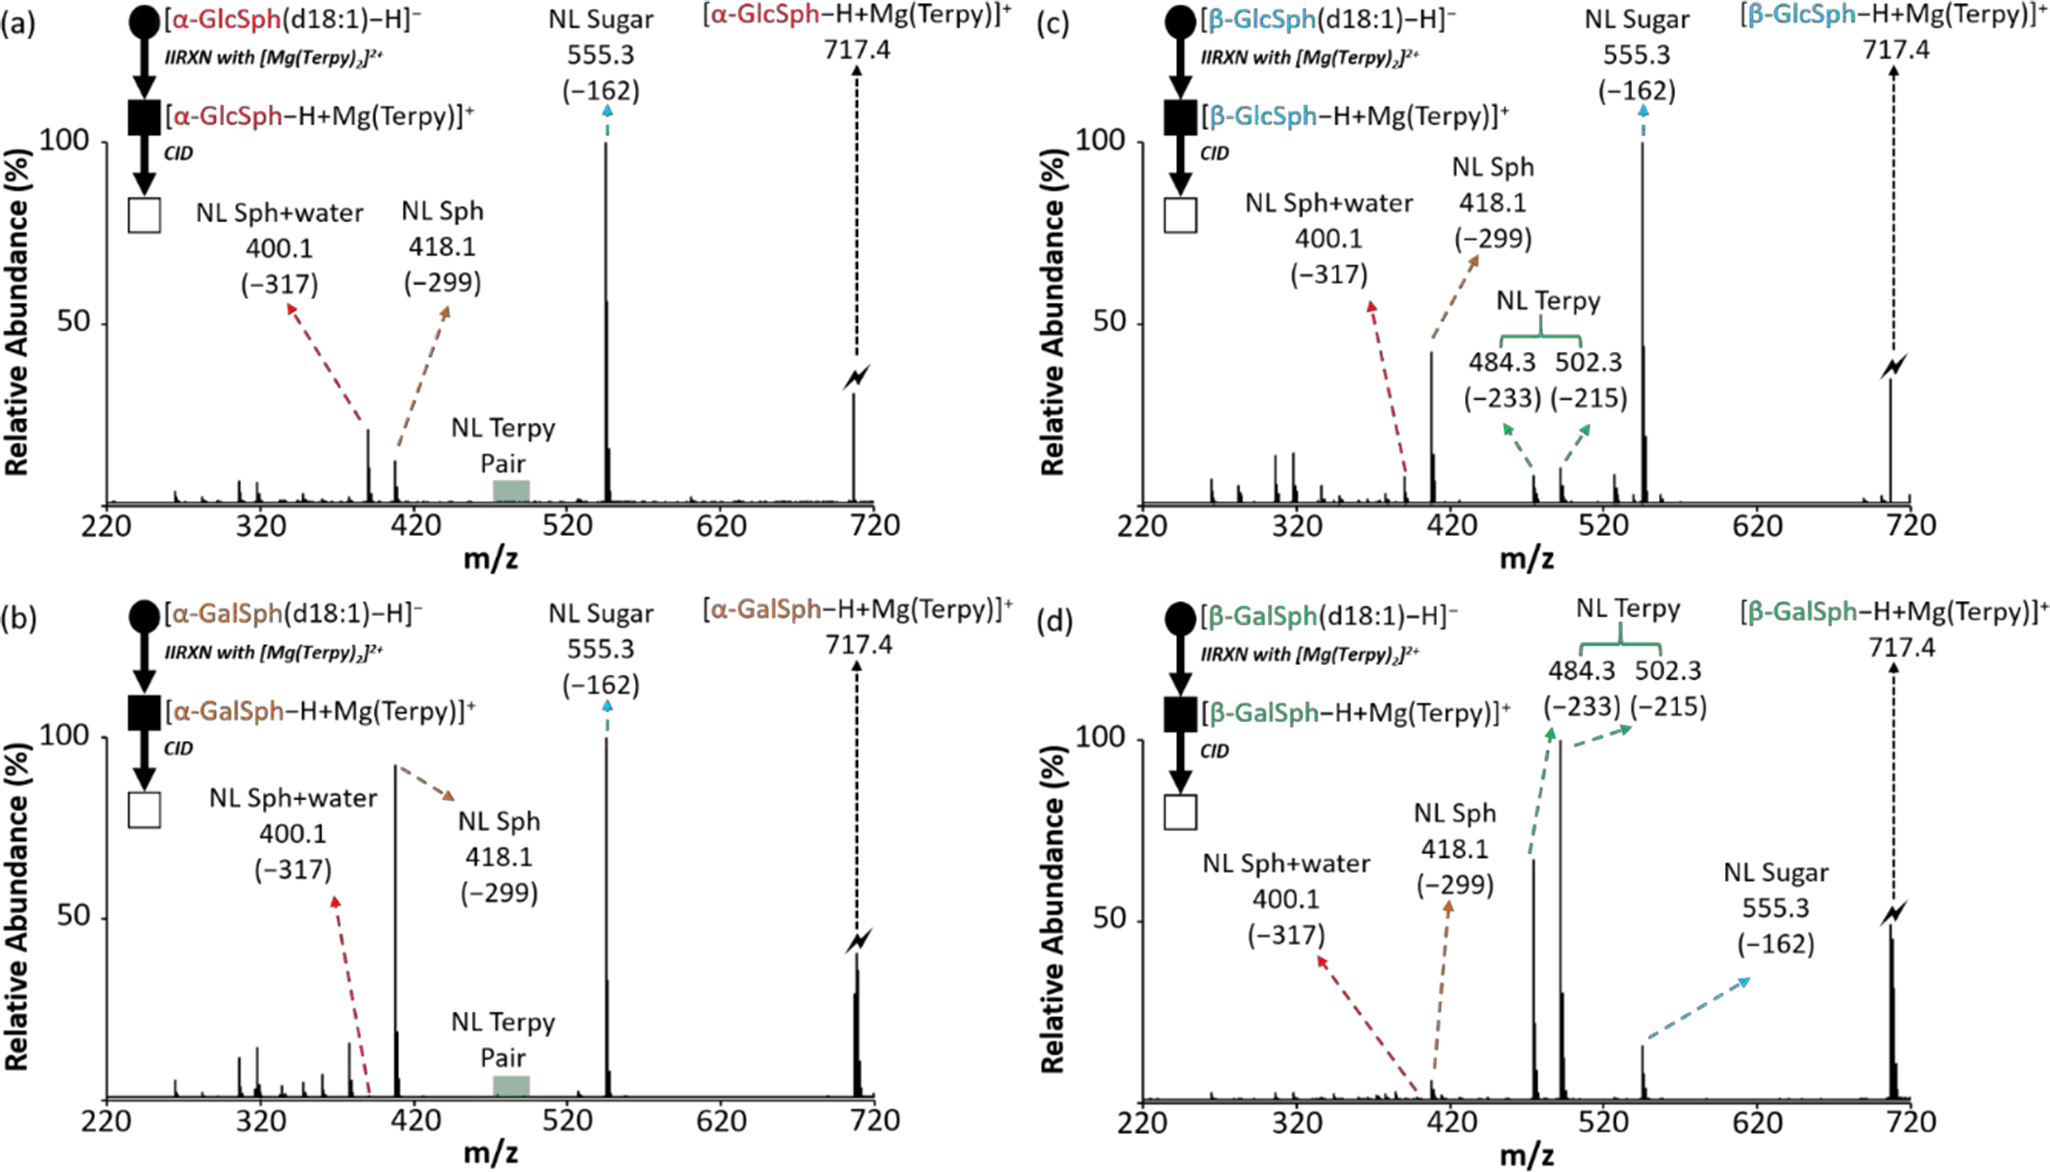
Figure 4.

The comparison of the CID spectra among glycosphingosines after gas-phase ion/ion reaction. (a) The CID spectrum of the [α-GlcSph–H + MgTerpy]+ (m/z 717.4). (b) The CID spectrum of the [α-GalSph–H + MgTerpy]+ (m/z 717.4). (c) The CID spectrum of the [β-GlcSph–H + MgTerpy]+ (m/z 717.4). (d) The CID spectrum of the [β-GaSph–H + MgTerpy]+ (m/z 717.4). The values inside the parenthesis indicate the neutral loss. The symbols represent as same as those in Figure 2.
