FIG 4.
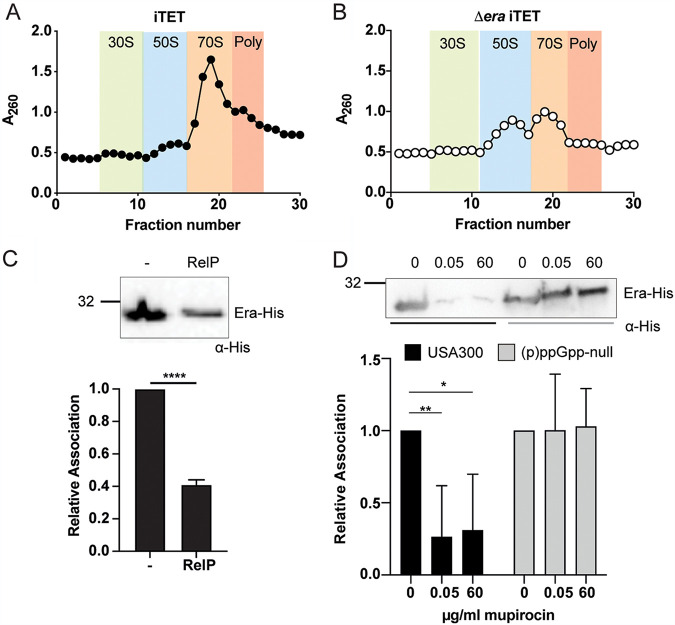
Association of Era to the 30S subunit is reduced under stringent conditions. (A and B) Ribosome profiles of the S. aureus USA300 iTET (A) and USA300 Δera iTET (B) strains. RNA content was analyzed at an absorbance of 260 nm. All experiments were performed in triplicate, with one representative profile included for each strain. Expected regions for 30S subunits (green), 50S subunits (blue), 70S ribosomes (orange), and polysomes (pink) are highlighted. (C) Ribosome association of Era-His from USA300 Δera iTET-era-His pALC2073 and USA300 Δera iTET-era-His pALC2073-relP strains. (Top) Western immunoblot showing the association of Era-His to 30S ribosomes. USA300 Δera iTET-era-His pALC2073 (left) and USA300 Δera iTET-era-His pALC2073-relP (right) strains were grown to an OD600 of 0.8 and induced with 100 ng/ml Atet for 30 min to induce the expression of both Era-His and RelP. Ribosomal subunits were separated, and the amount of Era-His associated in each strain was detected using HRP-conjugated α-His antibodies. Experiments were carried out in triplicate, and one representative image is shown. (Bottom) The mean signal intensities relative to the empty vector control (USA300 Δera iTET-era-His pALC2073) sample of all repeats were plotted, with error bars representing standard deviations. Statistical analysis was carried out using unpaired, two-tailed t testing (****, P < 0.0001). (D) Ribosome association of Era-His from USA300 Δera iTET-era-His and USA300 (p)ppGpp-null Δera iTET-era-His strains. (Top) Western immunoblot showing the association of Era-His to 30S ribosomes. Both strains were grown to an OD600 of 0.6, and Era expression was induced with 100 ng/ml Atet for 30 min, followed by 0.05 or 60 μg/ml mupirocin for 15 min to induce the stringent response. Ribosomal subunits were separated, and the amount of Era-His associated was detected with HRP-conjugated α-His antibodies. Experiments were carried out in triplicate, and one representative image is shown. (Bottom) The mean signal intensities relative to the zero mupirocin sample of all repeats were plotted, with error bars representing the standard deviations. Statistical analysis was carried out using a one-way ANOVA, followed by Tukey’s multiple-comparison test (*, P < 0.05; **, P < 0.01).

