Figure 2.

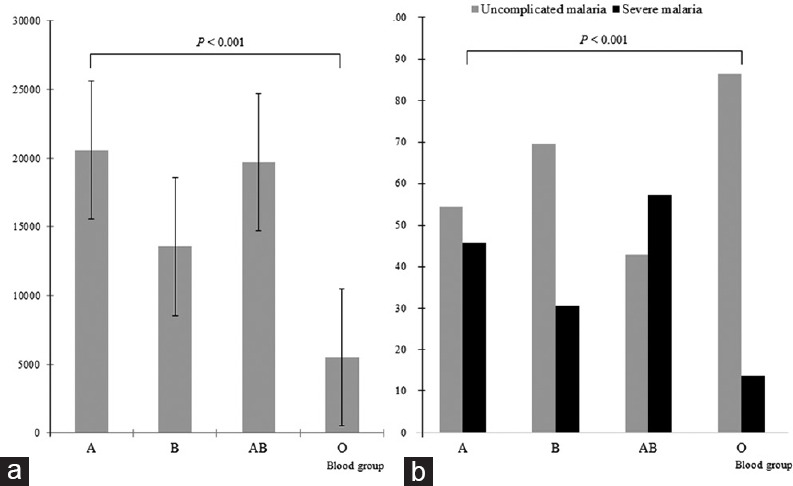
Comparison of the asexual parasite density means according ABO blood group (a) and comparison of severe malaria rate with ABO blood group (b). The error bars represent the standard deviation of the asexual parasite density means

Comparison of the asexual parasite density means according ABO blood group (a) and comparison of severe malaria rate with ABO blood group (b). The error bars represent the standard deviation of the asexual parasite density means