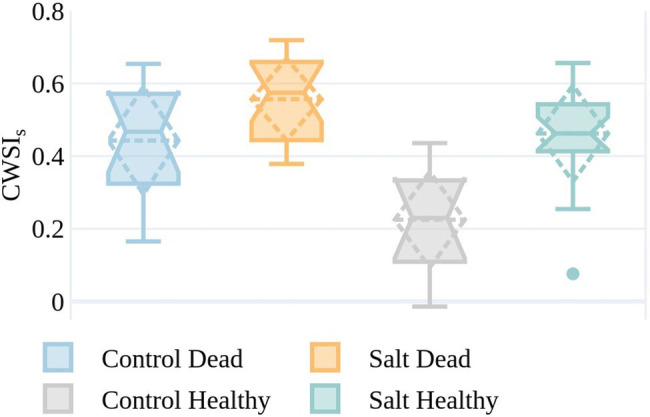
Figure 10.

CWSIs values on December 6 for the simplified statistical method for plants from both the control and salt-treated plots identified as either dead (by ground-based visual observation) on January 4 or healthy (by RGB image assessment) on January 7. The boxes span the interquartile range (IQR), with notches indicating the median and the dashed diamond the standard deviation and mean. The whiskers bound the 1.5*IQR. The sample size is reflective of the plants that were identifiable in the UAV imagery with the GRVI > 0 and plant temperature <air temperature +9°C on both December 6 and January 7, or field-identified as dead on January 4 (control dead=12, control healthy=10, salt dead=18, and salt healthy=20).
