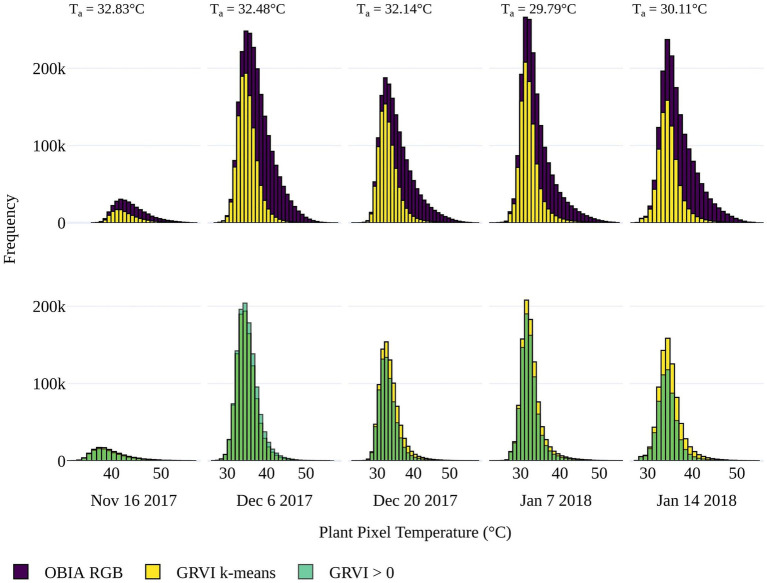
Figure 4.
Top Distribution of pixel-based temperatures within the plant delineations from the OBIA approach applied to the red green blue (RGB) data (purple) and for vegetation within the delineations determined by k-means clustering using a two-cluster a priori on the (GRVI; yellow) for the five UAV data collection dates. Bottom) The distribution of pixel-based temperature for vegetation classified where GRVI > 0 (green), overlaid on the k-mean approach (yellow) for comparison. When there is a greater frequency of pixels classified as vegetation with GRVI > 0 than the k-means approach (i.e., for December 6), it is shown in a lighter green color. Average air temperature (Ta) is shown for each flight.

