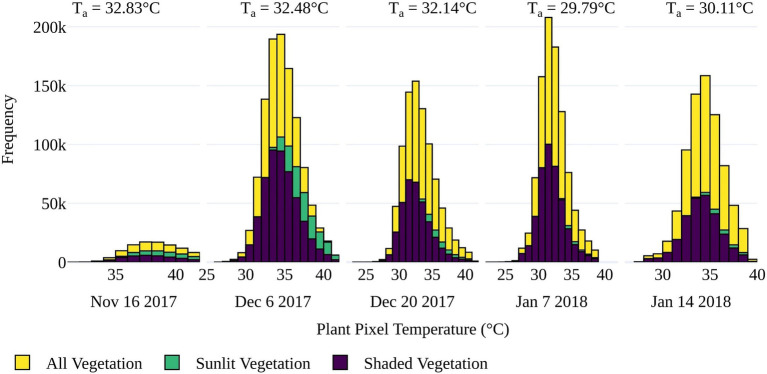
Figure 6.
Distribution of pixel temperatures for sunlit, shaded, and all vegetation as classified by GRVI > 0 for the five UAV data collection dates. Sunlit vegetation was identified as pixels with a reflectance value greater than the maximum value in the first cluster of a five-cluster k-mean approach based on the blue band. Average air temperature (Ta) during each flight is also displayed.

