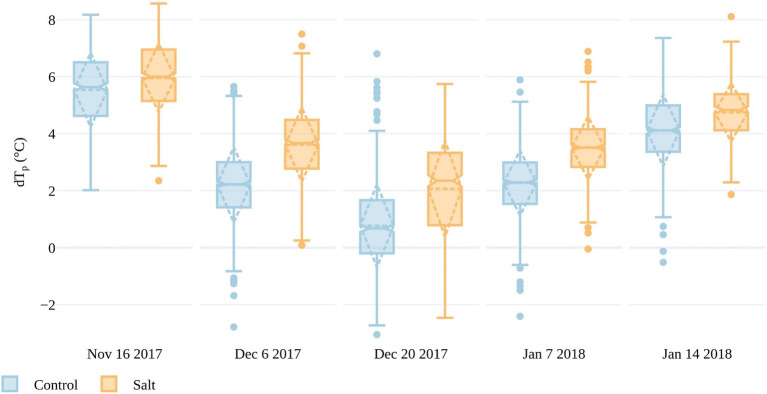
Figure 7.
Differences between plant and air temperatures (dTp) for all plants within the salt and control plots for the five UAV campaigns. The boxes span the interquartile range (IQR), with notches indicating the median and the dashed diamond the standard deviation and mean. The whiskers bound 1.5*IQR.

