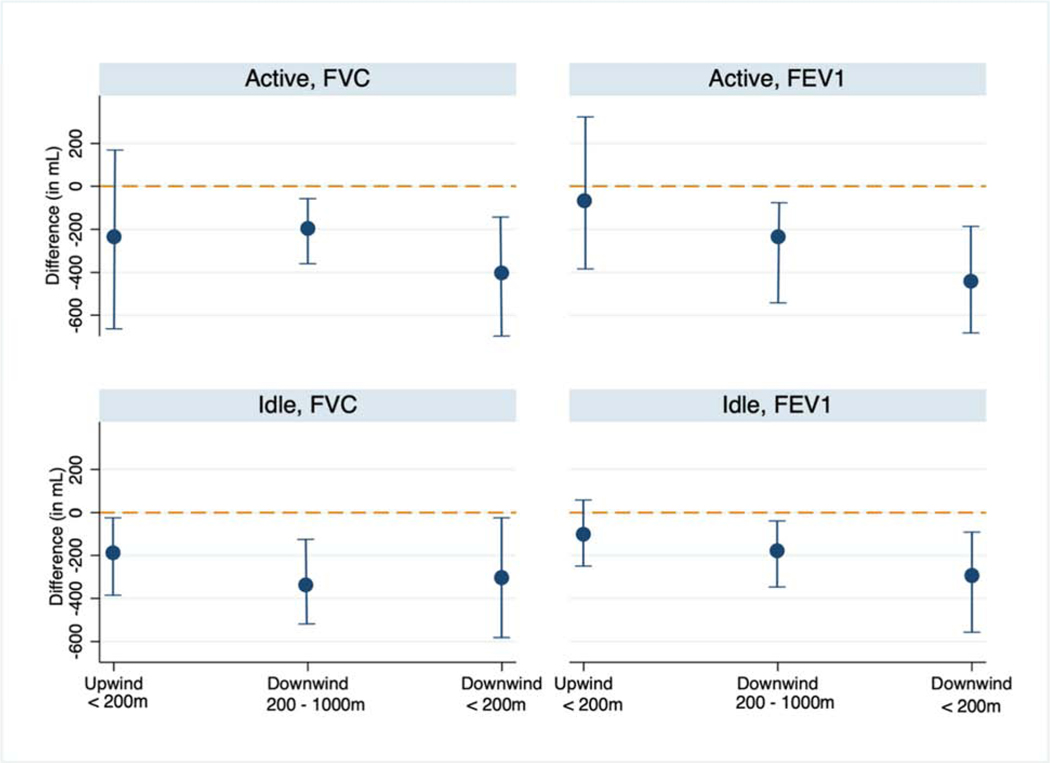
Figure 6.
Average difference in FEV1 (left) and FVC (right) in mL compared to participants living upwind and 200–1000m from the OGD site stratified by neighborhood. Top row show results for participants living near the active OGD site (Jefferson Park neighborhood) and bottom row is among participants living near the idle OGD site (North University Park). The reference category is living upwind and more than 200m from an OGD site. Models are adjusted for age, height, age-height interaction, sex, race/ethnicity, weight, asthma diagnosis, recent flu/cold, ever smoker, indoor exposure to environmental tobacco smoke, living near a freeway, season, spirometry technician and a random effect for residential household.

