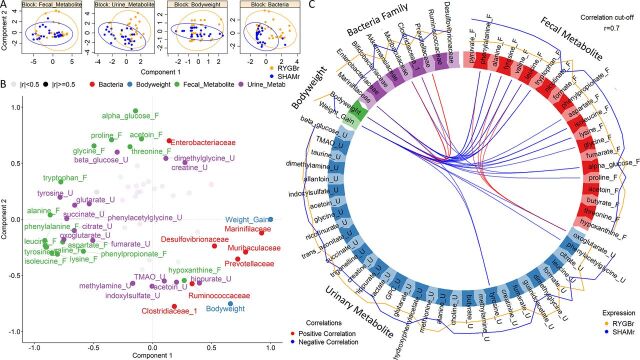
FIG 6.
Integration of urinary metabolites (names ending with “_U”), fecal metabolites (names ending with “_F”), fecal bacteria at familial level, body weight, and weight gain using a DIABLO algorithm in the mixOmics R package. Data from six time points (preantibiotics, days 1, 3, 6, 9 and 16) were included for correlation analysis. (A) Component plots for each data set depicting the clustering of subjects with respect to RYGBr (orange) and SHAMr (blue) group. (B) Variables plots generated by calculating the correlation between variables. Variables, which are strongly positively correlated, are projected closely to each other; the longer the distance between the variables and the origin, the stronger the correlation between the variables. Correlations above the threshold (r = 0.5) were labeled in the plot. (C) Circos plot depicting correlations between variables in different data sets. Red and blue lines inside the circle indicate positive and negative correlation between the variables, respectively. Correlations above the threshold (r = 0.7) are depicted. The lines around the ideogram indicate average levels of expression of each variable from RYGBr (orange) and SHAMr (blue) groups. The further the line to the circle, the higher expression the variable is compared to the other group.

