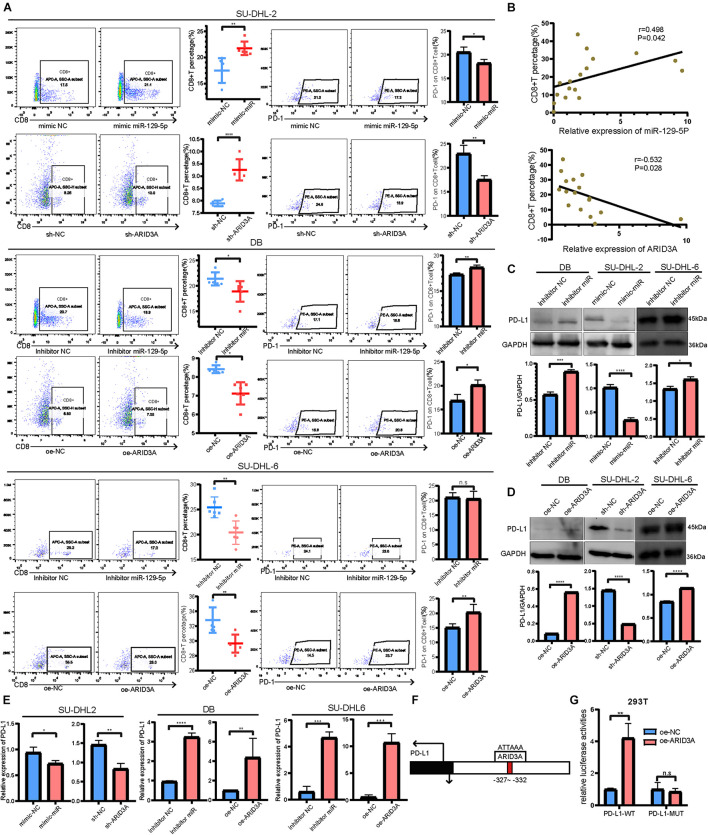
FIGURE 5.
(A) CD8+ T cell percentage and the surface PD-1 expression were determined using flow cytometry analysis when co-cultured with SU-DHL-2, DB and SU-DHL-6 cells and transfected cells. Mean ± SD (n = 6). (B) Pearson’s correlation curve showing the positive relation between CD8+ T cells and miR-129-5p and the negative relation between CD8+ T cells and ARID3A in DLBCL peripheral blood. (C,D) Western blotting and densitometric analyses showing PD-L1 protein levels in transfected and negative control DB, SU-DHL-2 and SU-DHL-6 cells. (E) Expression of PD-L1 mRNA in transfected and negative control cells were determined using RT-qPCR. (F) Predicted ARID3A binding site in the PD-L1 promoter were acquired using JASPAR. (G) Dual-luciferase reporter gene assays were performed to show that ARID3A regulated PD-L1 as a transcription factor. Mean ± SD (n = 3). *P < 0.05; **P < 0.01; ***P < 0.001; ****P < 0.0001.

