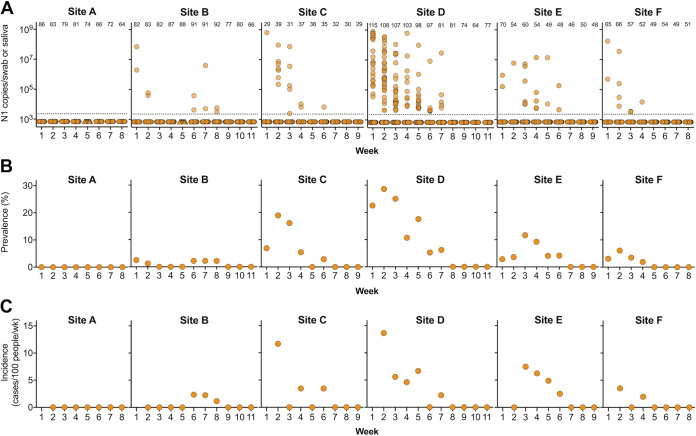
FIG 1.
SARS-CoV-2 infections in six Colorado LTCFs. (A) SARS-CoV-2 N1 vRNA levels in nasopharyngeal swab (circles) or saliva (triangles) samples. Saliva was only sampled a single time (week 5) at two sites (A and B) due to nasopharyngeal swab shortages. y axis represents N1 copy number per swab or saliva sample. Dotted line indicates limit of detection. Numbers across the top indicate number of samples tested each week. (B) Prevalence of SARS-CoV-2 each week at each site (percentage of samples with detectable N1 vRNA out of total number tested). (C) Incident cases were defined as individuals who tested positive for N1 vRNA for the first time and had tested negative for infection 1 or 2 weeks prior. Not shown are prevalent infections among workers tested for the first time in week 2.

