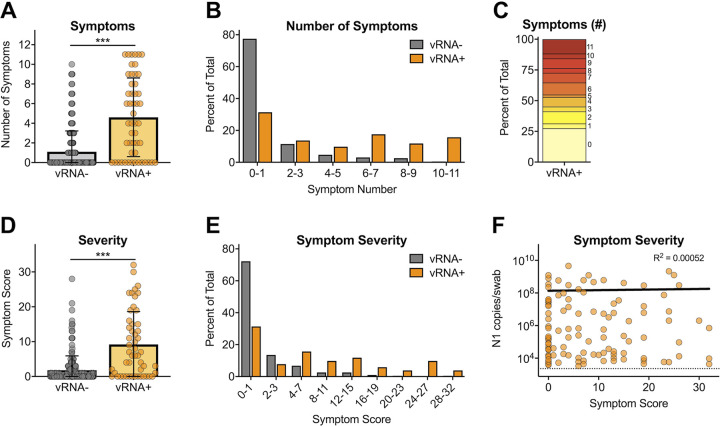
FIG 3.
SARS-CoV-2 symptom status, severity, and relationship to viral RNA. (A) Numbers of symptoms reported by vRNA− and vRNA+ participants (mean values ± SD). (B) Percentages of vRNA− and vRNA+ individuals stratified by number of symptoms. (C) Percentages of vRNA+ survey participants reporting total numbers of symptoms. (D) Cumulative symptom score (not reported = 0, mild = 1, medium = 2, severe = 3) for all 11 symptoms stratified by vRNA− and vRNA+ participants (mean values ± SD). (E) Percentages of vRNA− and vRNA+ individuals stratified by symptom score. (F) Relationship between cumulative symptom score and N1 vRNA levels (semilog nonlinear regression line fit). ***, P < 0.0001 by Mann-Whitney unpaired nonparametric test.

