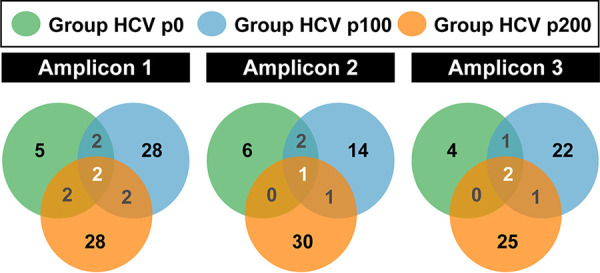
FIG 3.

Distribution of haplotype peaks among HCV groups. Venn diagrams indicating for each amplicon the number of peaks unique to one HCV group and those shared by two or more HCV groups. Populations are color coded. Peak identity was determined according to data summarized in Table 1, Fig. 2, and in the supplemental material; statistical significances are given in Table S3 (https://saco.csic.es/index.php/s/sFQnRii4dC94LRN).
