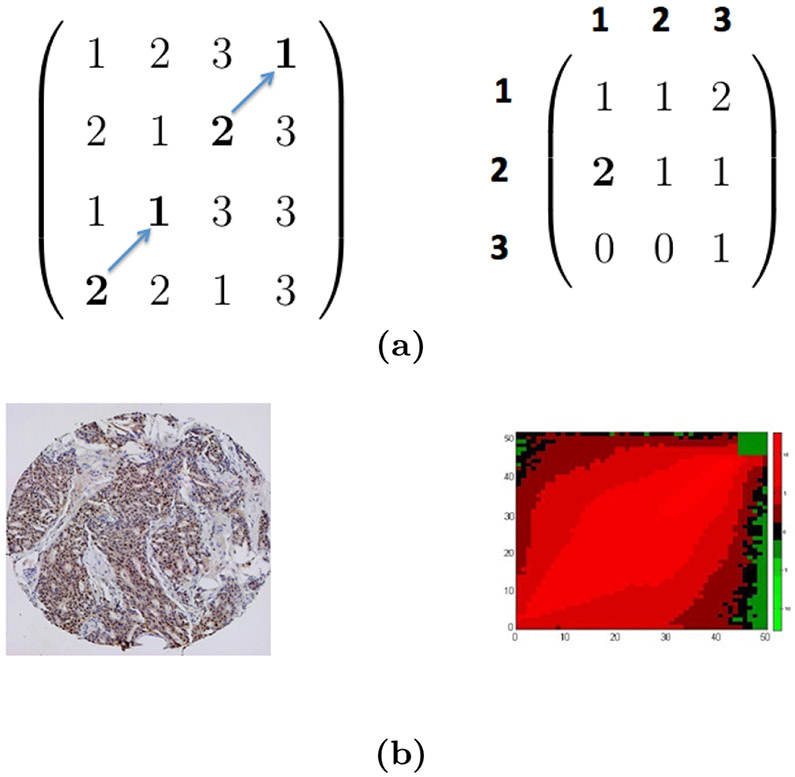
Figure 2. Example images and GLCMs.
(a) A toy image and its GLCM. The toy image is a 4 × 4 image with a 3 × 3 GLCM for ~= (↗, 1). (b) A TMA image (left panel) and the heatmap of its GLCM (right panel, in log scale, and taken from [65]). In the right panel, the axis labels (0-50) indicate the normalized pixel values in a TMA image; the color (scale indicated by a color bar) of the heatmap represents the value of entries in the GLCM.

