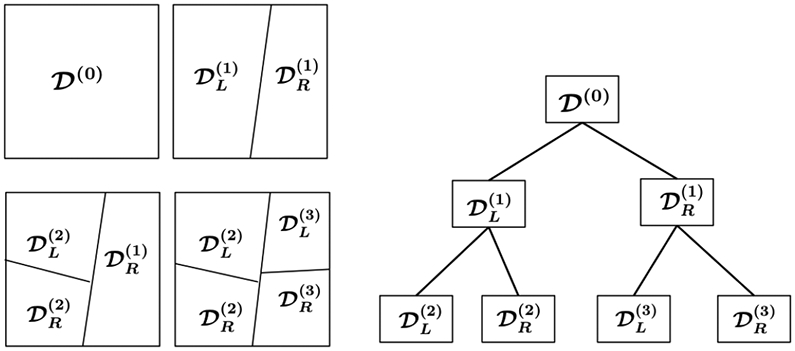
Figure 4.

Illustration of space partition and random projection trees. The superscripts indicate the order of tree node split. One starts with the root node, , which corresponds to all the data. After the first split, is partitioned into its two child nodes, {, }. The second split partitions the left child node, , into its two child nodes, {, }. The third split, which split the right child node of the root node, , leads to two new child nodes, {, }. This process continues until a stopping criterion is met.
