. 2021 Oct 1;10:e70918. doi: 10.7554/eLife.70918

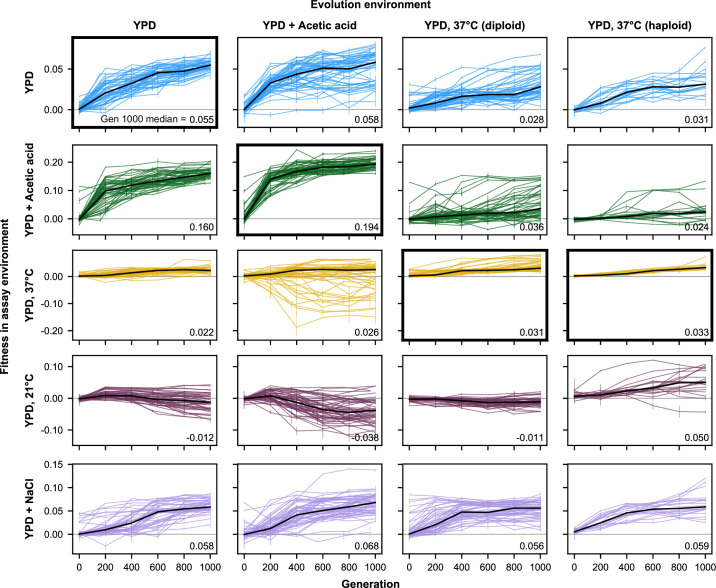
Figure 2. Fitness changes over 1000 generations of evolution.

(A) Population fitness trajectories. Replicate populations for each evolution condition are shown in each column. Environments in which the fitnesses of these populations were assayed are shown in the rows. Plots for which evolution and assay environment are the same are indicated by a bold outer border. The black line in each plot indicates the median fitness. Error bars indicate standard error of the mean. (B) Summary of population changes in fitness: generations 0–1000. Populations are categorized according to whether their fitness at generation 1000 is equal to, less than, or greater than their fitness at generation zero. Significance of fitness differences evaluated using one-sided Welch’s unequal variances t-tests, the number of observations for both fitness values is 2.

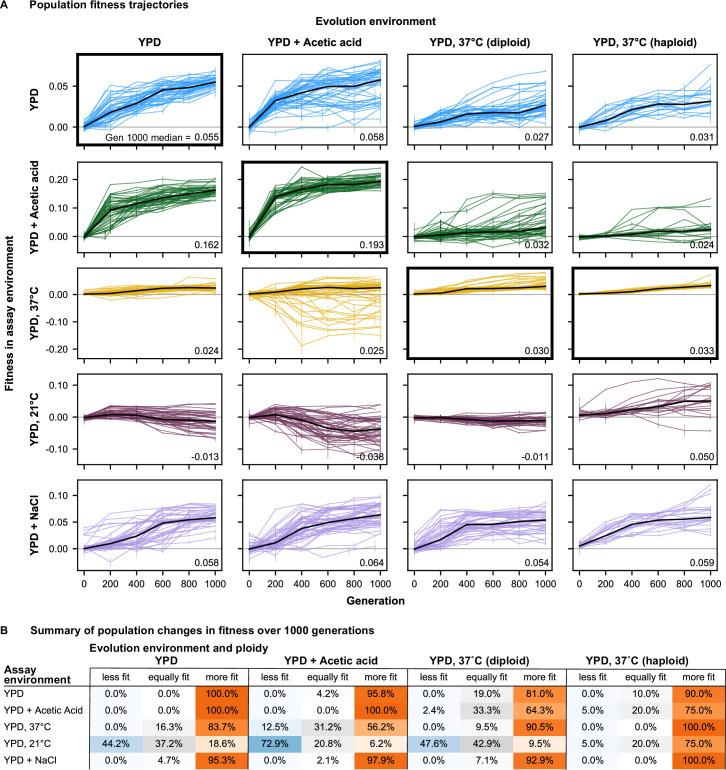
Figure 2—source data 1. Bulk fitness assay read counts and measured fitnesses.
Figure 2—source data 2. Statistical significance of fitness changes over time.

Figure 2.

Figure 2—figure supplement 1. Fitness changes over 1000 generations of evolution for unfiltered data (outliers included).

Figure 2—figure supplement 1.

Replicate populations for each evolution condition are shown in each column. Environments in which these populations’ fitnesses were assayed are shown in the rows. Plots for which evolution and assay environment are the same are indicated by a bold outer border. The black line in each plot indicates the median fitness. Error bars indicate standard error of the mean.
Figure 2—figure supplement 2. Summary of population changes in fitness: generations 0­–200.

Figure 2—figure supplement 2.

Percentage of populations that improve, decline, and maintain similar relative fitness from generations 0–200 for each combination of evolution and assay environments. Summary statistics provided in Figure 2—source data 2.
Figure 2—figure supplement 3. Summary of population changes in fitness: generations 0–400.

Figure 2—figure supplement 3.

Percentage of populations that improve, decline, and maintain similar relative fitness from generations 0–400 for each combination of evolution and assay environments. Summary statistics provided in Figure 2—source data 2.
Figure 2—figure supplement 4. Summary of population changes in fitness: generations 0–600.

Figure 2—figure supplement 4.

Percentage of populations that improve, decline, and maintain similar relative fitness from generations 0–600 for each combination of evolution and assay environments. Summary statistics provided in Figure 2—source data 2.
Figure 2—figure supplement 5. Summary of population changes in fitness: generations 0–800.

Figure 2—figure supplement 5.

Percentage of populations that improve, decline, and maintain similar relative fitness from generations 0–800 for each combination of evolution and assay environments. Summary statistics provided in Figure 2—source data 2.
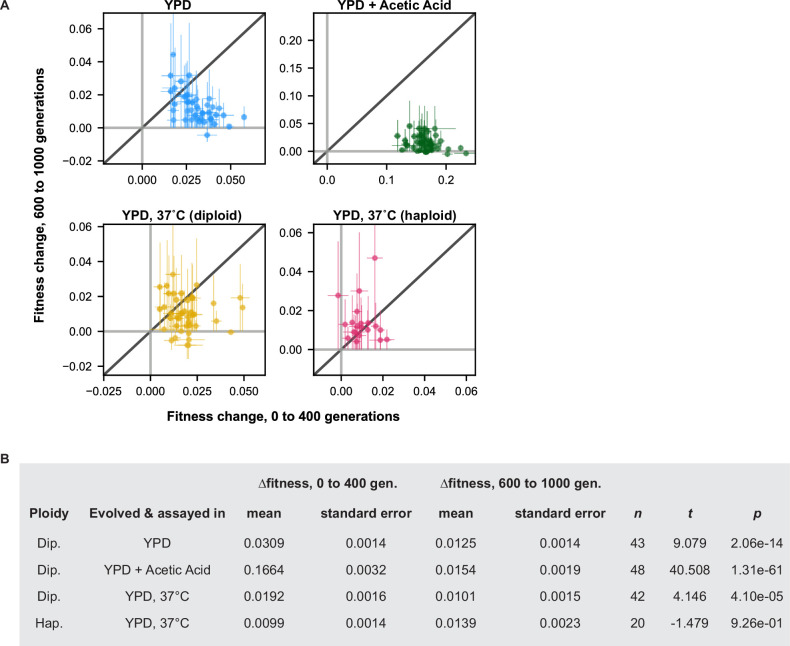
Figure 2—figure supplement 6. Changes in fitness early and late in evolution.

Figure 2—figure supplement 6.

(A) Changes in fitness over the first (0–400) and last (600–1000) 400 generations of the evolution experiment are plotted for each population. Points are colored by evolution condition (environment and ploidy). (B) Summary statistics for t-test comparing the mean change in fitness over the first and last 400 generations for all populations evolved in each condition. n refers to the number of populations in that evolution condition.