. 2021 Oct 1;10:e70918. doi: 10.7554/eLife.70918

Figure 3. E × E evolutionary trajectories over 1000 generations of evolution in a constant environment.

Axes correspond to fitness in the indicated assay environments. Colors correspond to evolution condition. Gray vertical and horizontal lines indicate zero fitness relative to an ancestral reference in each environment.

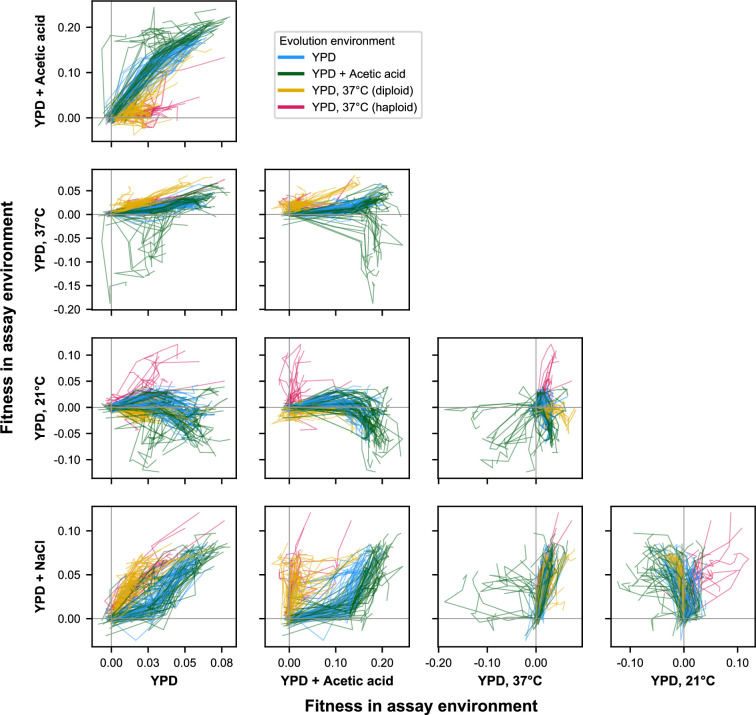
Figure 3.

Figure 3—figure supplement 1. E × E evolutionary trajectories over 1000 generations of evolution in a constant environment for unfiltered data (outliers included).

Figure 3—figure supplement 1.

Axes correspond to fitness in the indicated assay environments. Colors correspond to evolution condition. Gray vertical and horizontal lines indicate zero fitness relative to an ancestral reference in each environment.
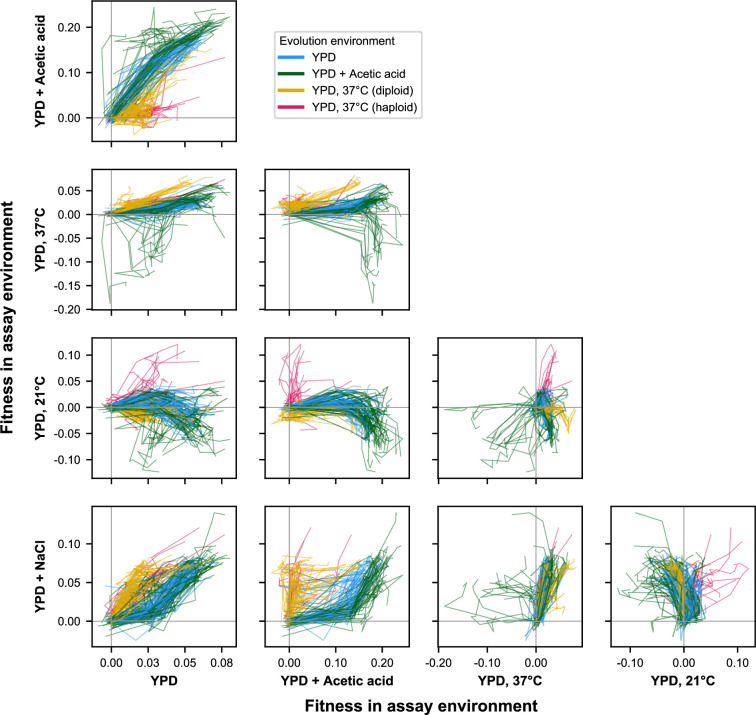
Figure 3—animation 1. Animation of Figure 3.