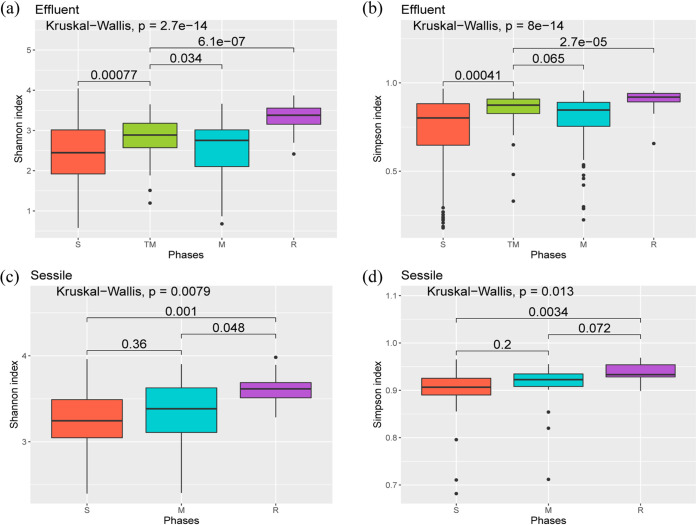
FIG 2.
Box plot of Shannon’s indices (a) and Simpson’s indices (b) for effluent communities across different phases of treated and nontreated columns. Box plot of Shannon’s indices (c) and Simpson’s indices (d) for sessile communities across different phases of treated and nontreated columns. A pairwise comparison for significance was conducted using the Wilcoxon test.

