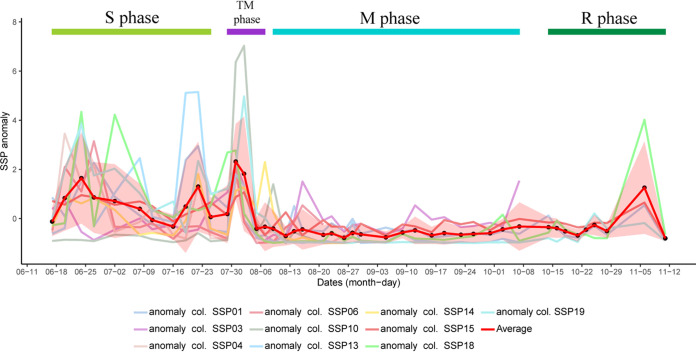
FIG 6.
Anomaly plots based on the relative abundance of specific SRB population (SSP) across different time points of the treated columns. The closest completed genome of SSPs for column 1, 4, 10, 13, 14, 18, and 19 is Desulfobacula toluolica Tol2; for column 2 and 15 is Desulfarculus baarsii DSM 2075; and for column 6 and 14 is Desulfococcus multivorans. Column 14 had two SSPs. The shaded region in the plot depicts the standard deviation for the average anomaly plot. Critical time points for each column are present in Table 1.

