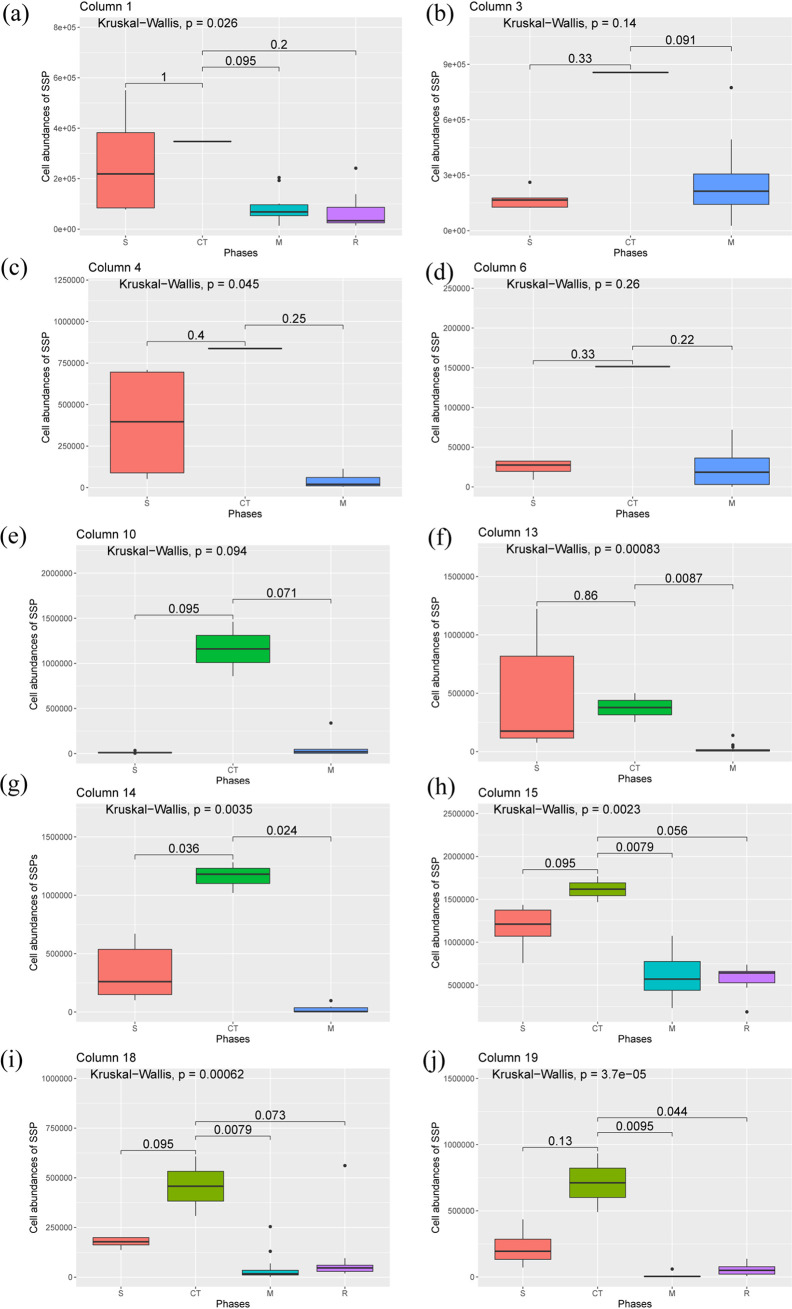
FIG 7.
Box plots showing the distribution of cell abundances of specific SRB population (SSP) across different phases of column 1 (a), column 3 (b), column 4 (c), column 6 (d), column 10 (e), column 13 (f), column 14 (g), column 15 (h), column 18 (i), and column 19 (j). S, CT, M, and R denote effluent samples from sulfidogenesis, critical time point, mitigation, and rebound-sulfidogenesis phases, respectively. The Kruskal-Wallis test was used to understand whether the overall changes in cell abundances of SSPs across different phases are significant. The values mentioned for pairwise comparisons of cell abundances between phases are the P values from the Wilcoxon test.

