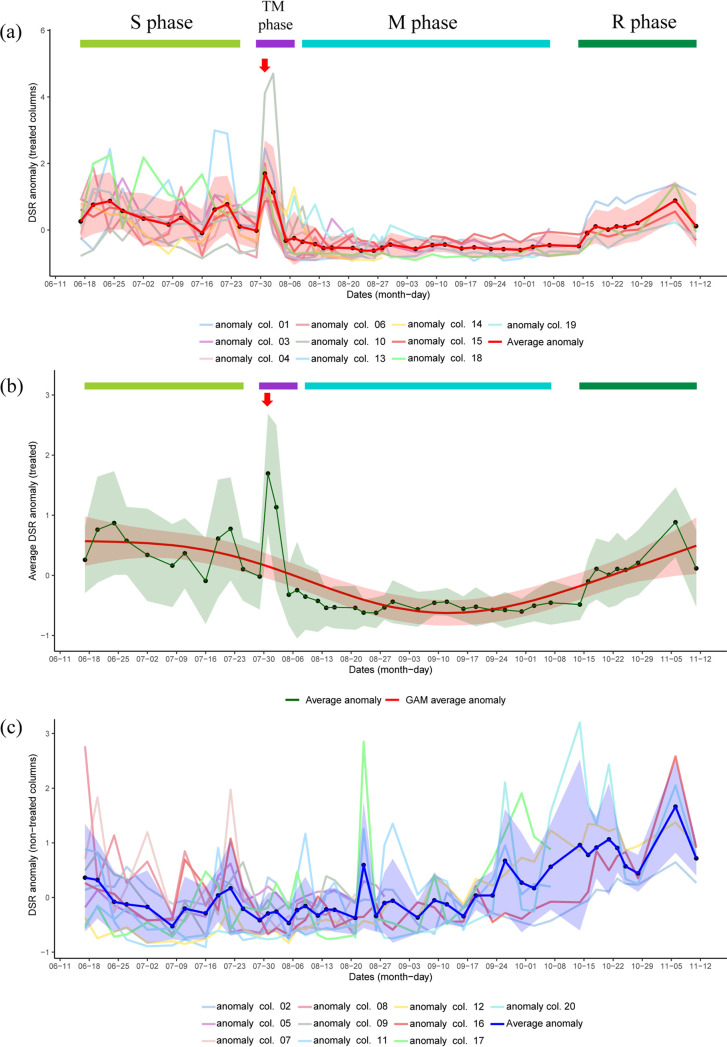
FIG 8.
Shift in dissimilatory sulfate reduction pathway (DSR) abundance across different time points in treated and nontreated columns. (a) Anomalies of DSR pathway abundances in treated columns along with the average anomaly for each time point. Initiation of the TM phase indicates initiation of nitrate treatment, and the red arrow represents time point NB. (b) Average anomaly of DSR with line smoothing using a generalized additive model (GAM) in treated columns. Initiation of TM phase indicates initiation of nitrate treatment, and the red arrow represents time point NB. (c) Anomalies of DSR pathway abundances in nontreated columns along with average anomaly for each time point. Shaded regions in the plots indicate standard deviations for average anomaly plots, whereas the shaded region for the GAM plot indicates ± 2 standard error.

