. 2021 Oct 6;12(43):14353–14362. doi: 10.1039/d1sc02941j

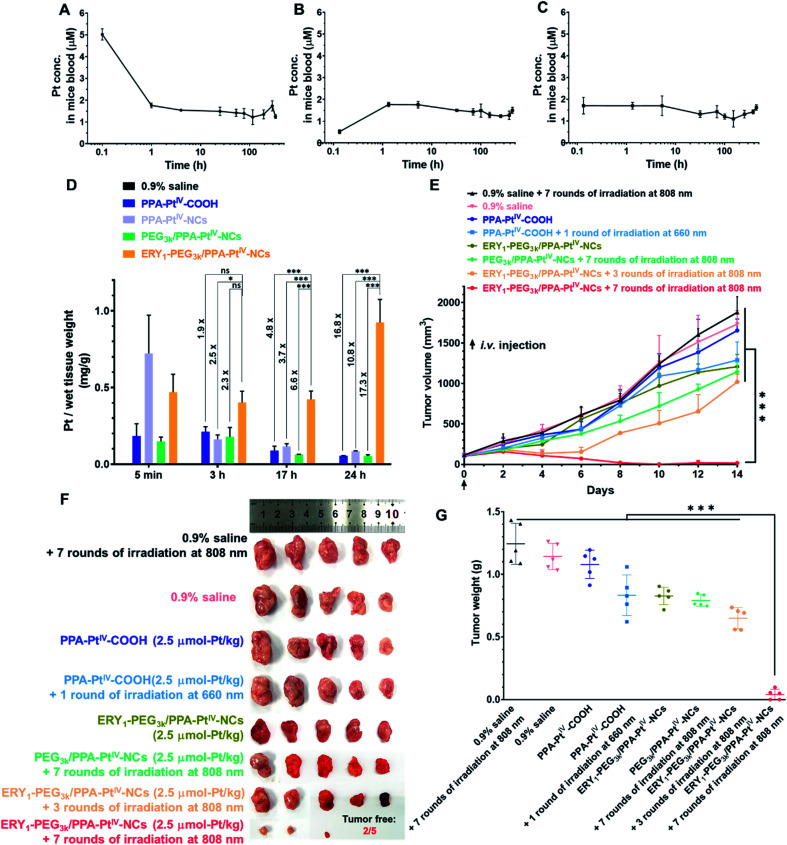
Fig. 3. Pharmacokinetic tests and anticancer evaluation in 4T1 tumor-bearing BALB/c mice after intravenous (i.v.) injection with various complexes. The Pt concentration curve in plasma at each time point is from single dose i.v. injection of (A) PPA-PtIV-COOH, (B) PEG3k/PPA-PtIV-NCs, and (C) ERY1-PEG3k/PPA-PtIV-NCs. (D) The Pt accumulation in the tumor determined by ICP-OES at each corresponding time point indicated. (E) Anticancer activity after treatment with various complexes. The indicated complexes were i.v. injected once on Day 0 and treated with or without irradiation. Irradiation conditions: 660 nm laser (100 mW cm−2) for 10 min per mouse, 808 nm laser (0.5 W cm−2) for 30 min (5 min irradiation with 5 min interval) per mouse. Experimental details are described in the ESI. (F) Photograph of excised tumors at the endpoint (Day 14) of anticancer evaluation. (G) Tumor weights of different treatment groups in the 4T1 xenograft model after the termination of anticancer evaluation. Mean ± SD; n = 3. *, p <0.05; ***, p <0.001; ns, no significance. Student's t-test.

Fig. 3