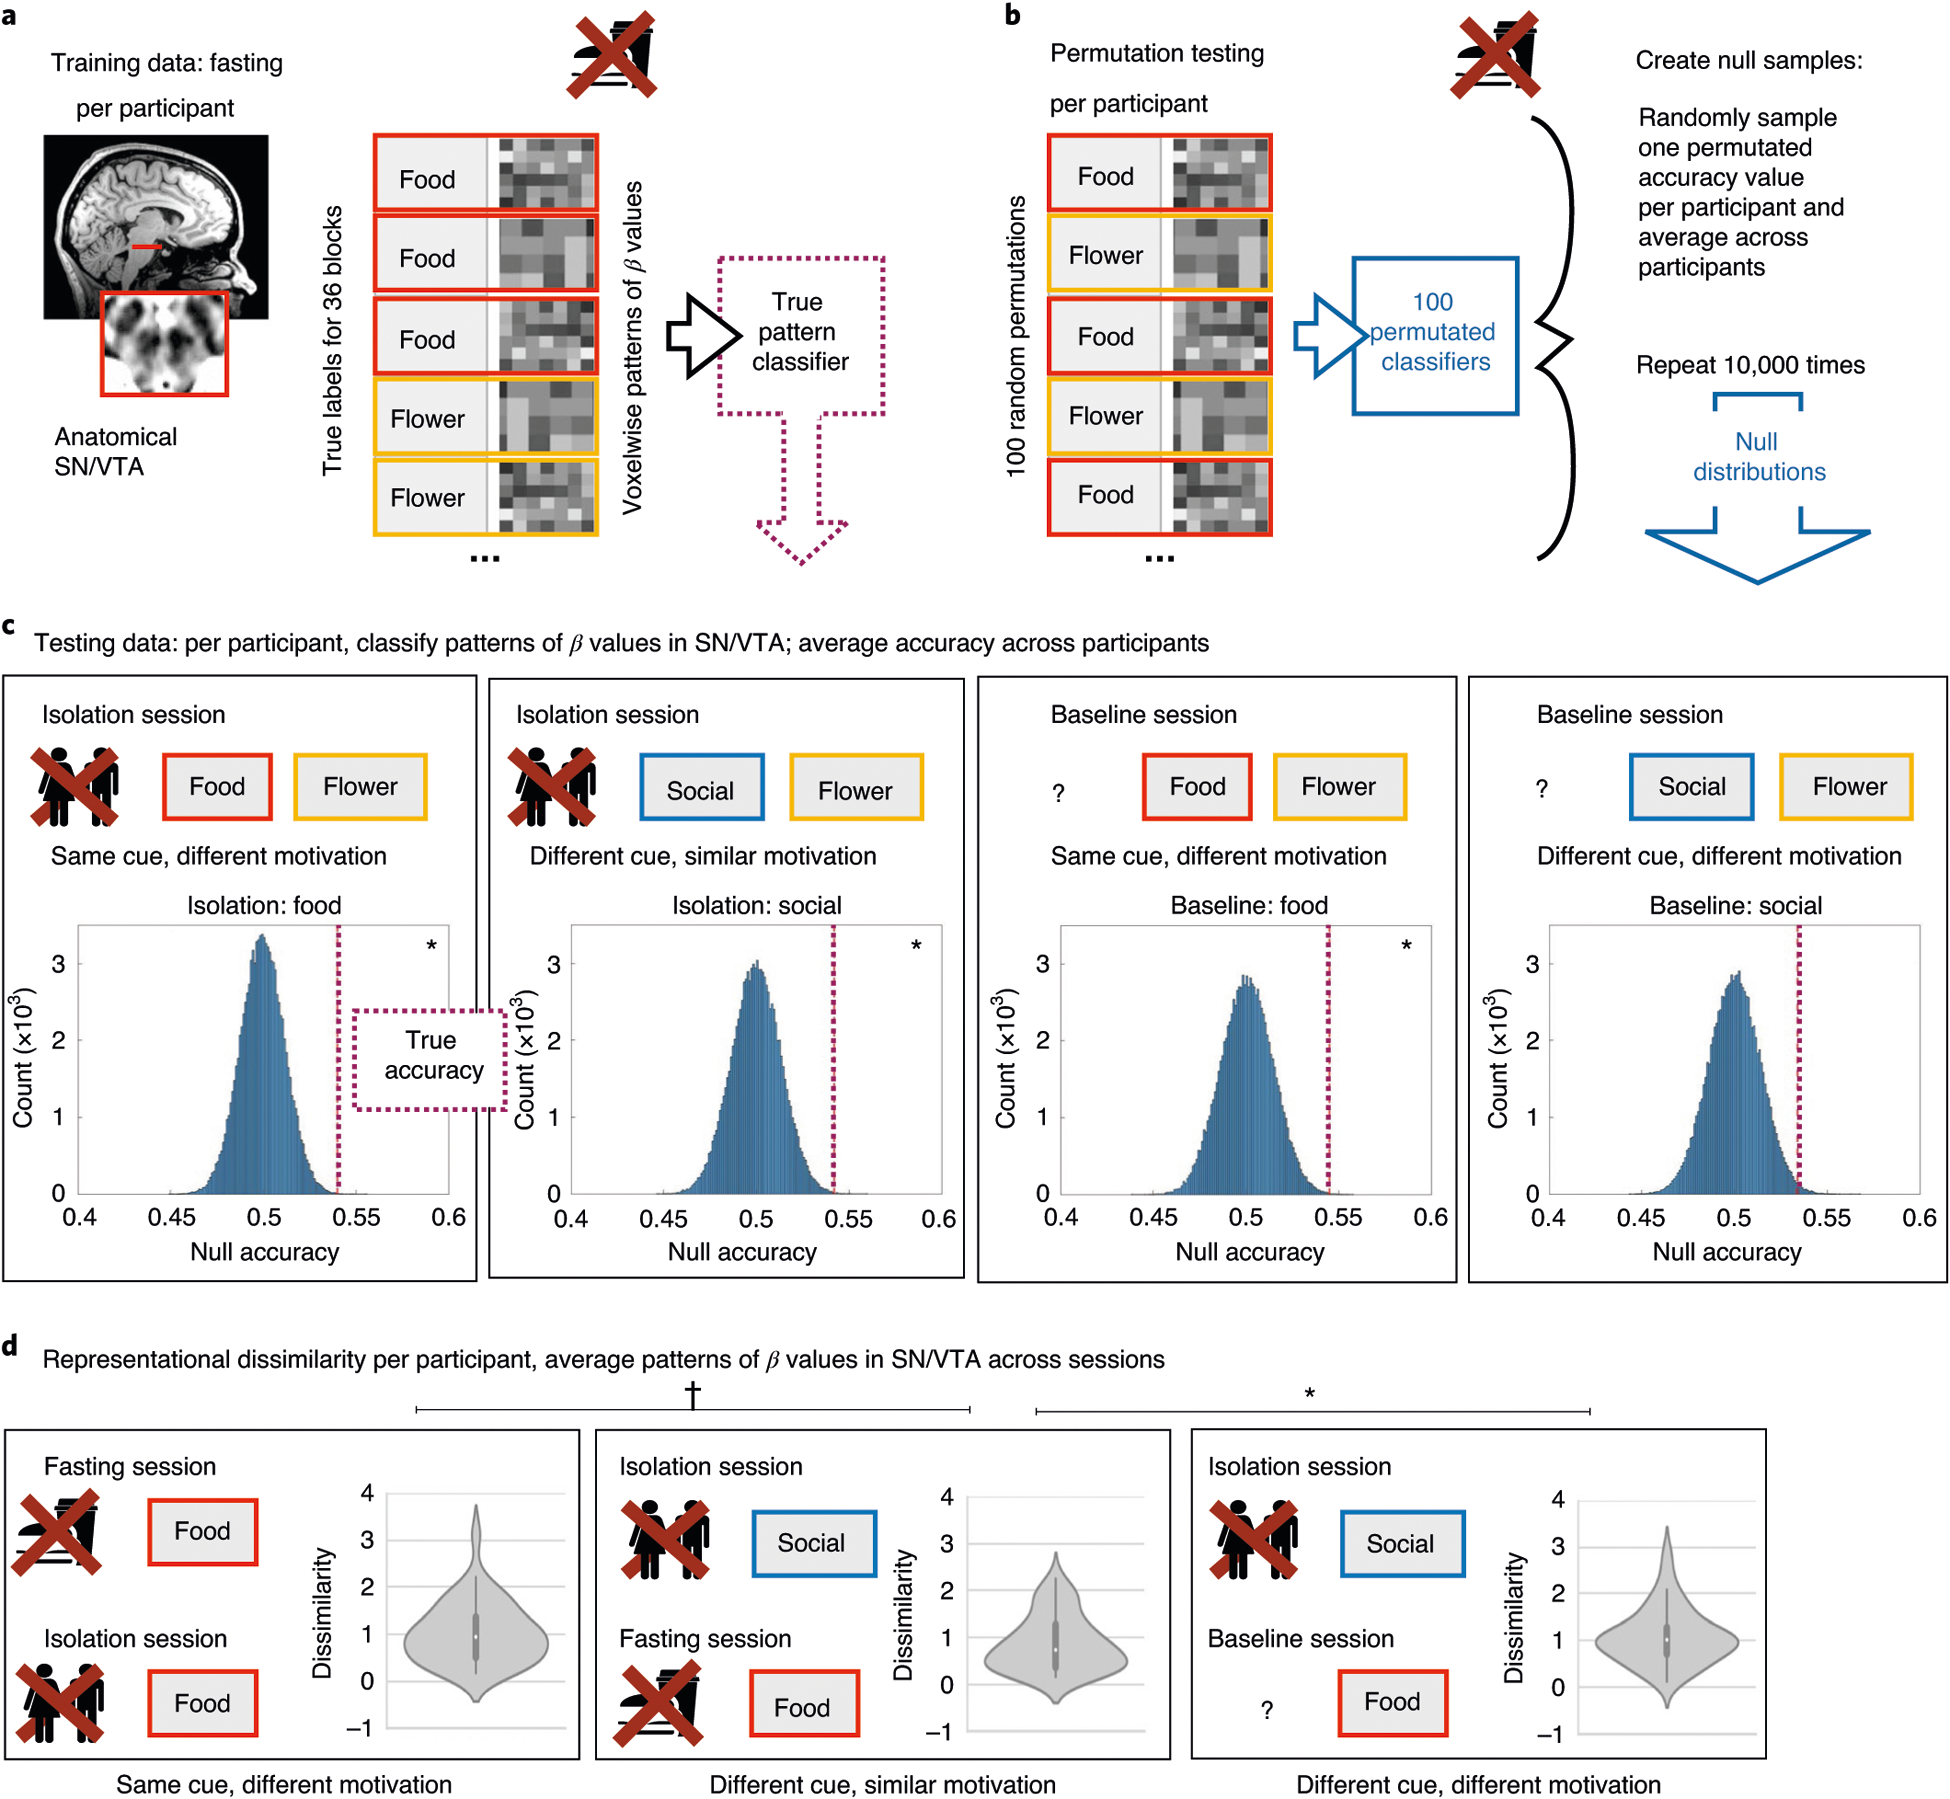
Fig. 4 |. Multivoxel pattern analysis.

a, A linear classifier was trained to distinguish the pattern of activity across voxels in the anatomical SN/VTA of each participant (n = 40), in response to food and control cues after fasting. This classifier was then tested on patterns of activity in the same participant in the other two sessions. b, For comparison, we generated null distributions using permutation and bootstrapping procedures: first, we permutated the labels within runs for each participant’s training data, and then we tested the permutated classifier on each testing dataset. We created a null distribution by randomly sampling one of the permutated accuracies for each participant and then averaging the accuracy values across subjects. This procedure was repeated 105 times to generate the group-level null distributions. c, Null distributions for each testing dataset. The dotted red line shows the true accuracy value (that is, classification accuracy from the real classifier) for each testing dataset. The classifier was generalized to (that is, successfully decoded above chance) food cues (versus control cues) on both isolation and baseline days and to social cues (versus control cues) on the isolation day, but not on the baseline day. d, We directly compared the spatial pattern of activity for deprived and nondeprived cues. Note that these results show Fisher-transformed dissimilarity, a measure of representational distance, so lower numbers indicate a more similar spatial pattern. The violin plots illustrate the distribution of the data, the white dots indicate the median, the bold dark-gray vertical line the IQR and the thin gray lines the 1.5× IQR minima and maxima. Social cues after isolation were more similar to food cues after fasting than to food cues at baseline. Food cues after fasting were (trending) more similar to social cues after isolation than food cues after isolation. Both c and d show that the pattern of activity in SN/VTA is determined not only by the category of visual stimulus, but also by the motivational salience of the category, with craved cues evoking a similar pattern whether what is craved is food or social interaction.
