. 2021 Oct 12;12(43):14432–14440. doi: 10.1039/d1sc04138j

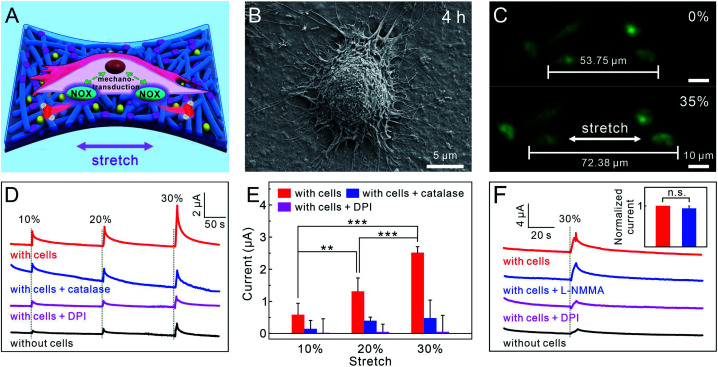
Fig. 4. (A) Schematic diagram of cellular mechanotransduction in stretched 16HBECs. (B) SEM image of 16HBECs cultured on a PPLC/PDMS film for 4 h. (C) Fluorescence microscopic images of 16HBECs cultured on a PPLC/PDMS film stained with Calcein-AM (green) and PI (red) before and after being stretched. Amperometric responses (D) and the corresponding statistical results (E) detected from 16HBECs submitted to different stretch stimuli (applied potential: +0.55 V vs. Ag/AgCl, data presented as mean ± standard error, n = 6, P-values were calculated using one-way ANOVA, **P < 0.01, ***P < 0.001). (F) Amperometric responses detected from 16HBECs submitted to 30% strain with different treatments at a potential of +0.55 V (vs. Ag/AgCl). Inset: corresponding normalized statistical results of amperometric responses recorded from cells stimulated with only strain (red cylinder) and cells pretreated with L-NMMA (blue cylinder) (data presented as mean ± standard error, n = 4, P-values were calculated using one-way ANOVA, n.s.: no significance). The vertical gray dashed lines in (D) and (F) indicated the beginning of the stretch stimuli; the hauling speed was 0.85 mm s−1.

Fig. 4