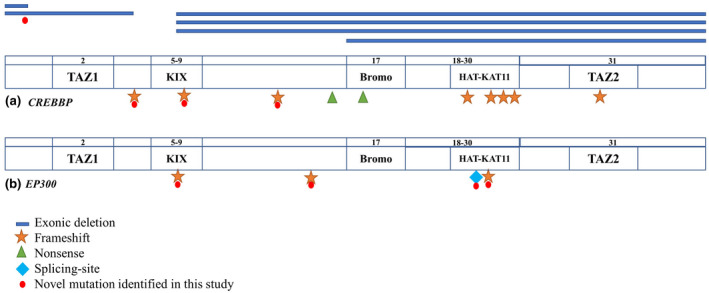
FIGURE 1.

Distribution of pathogenic variants detected along the CREBBP (A) and EP300 (B) genes. The location of each variant is marked on the exon schematic representation. Symbols represent types of variants.

Distribution of pathogenic variants detected along the CREBBP (A) and EP300 (B) genes. The location of each variant is marked on the exon schematic representation. Symbols represent types of variants.